

Build automations you can see
Design automations on a canvas that reads the same way to the person who built it and the engineer asked to review it — drag nodes, wire branches, and trace exactly what a run did before you trust it with anything critical. WEXTL turns busywork into workflows you can see, debug, and share.
- GDPR
- Data Encryption
- 2FA
- Local Data Region
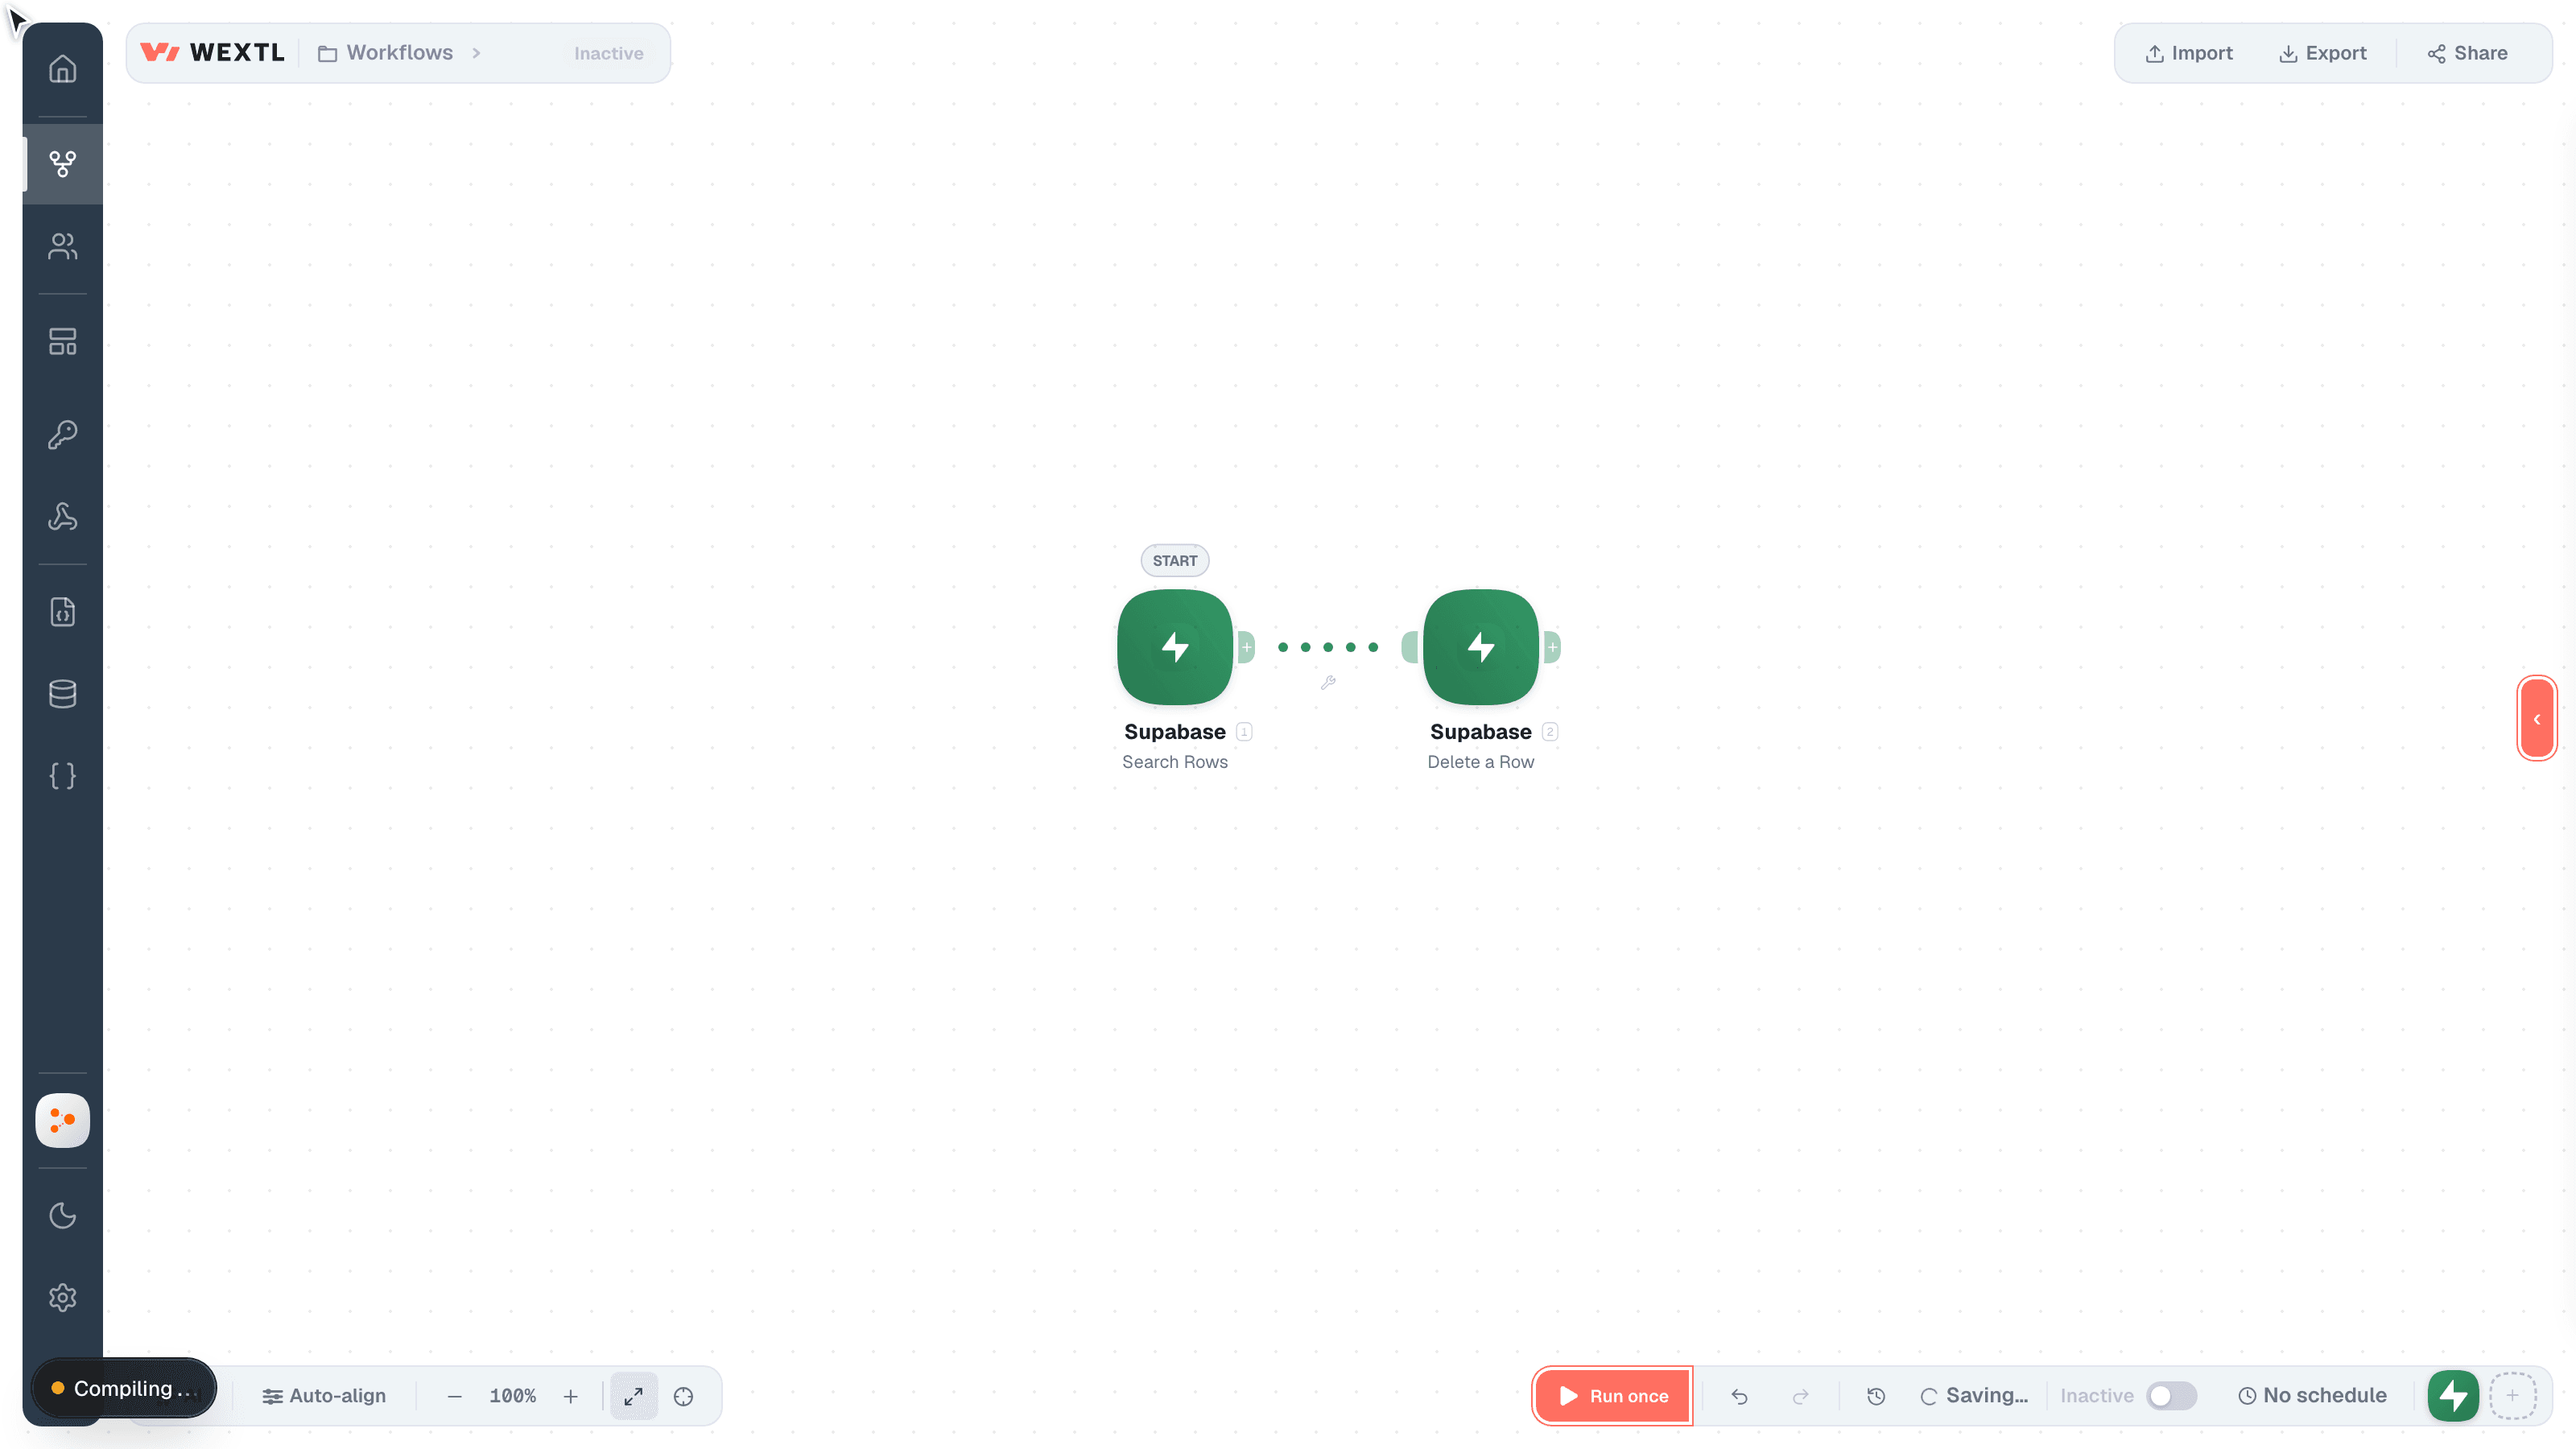
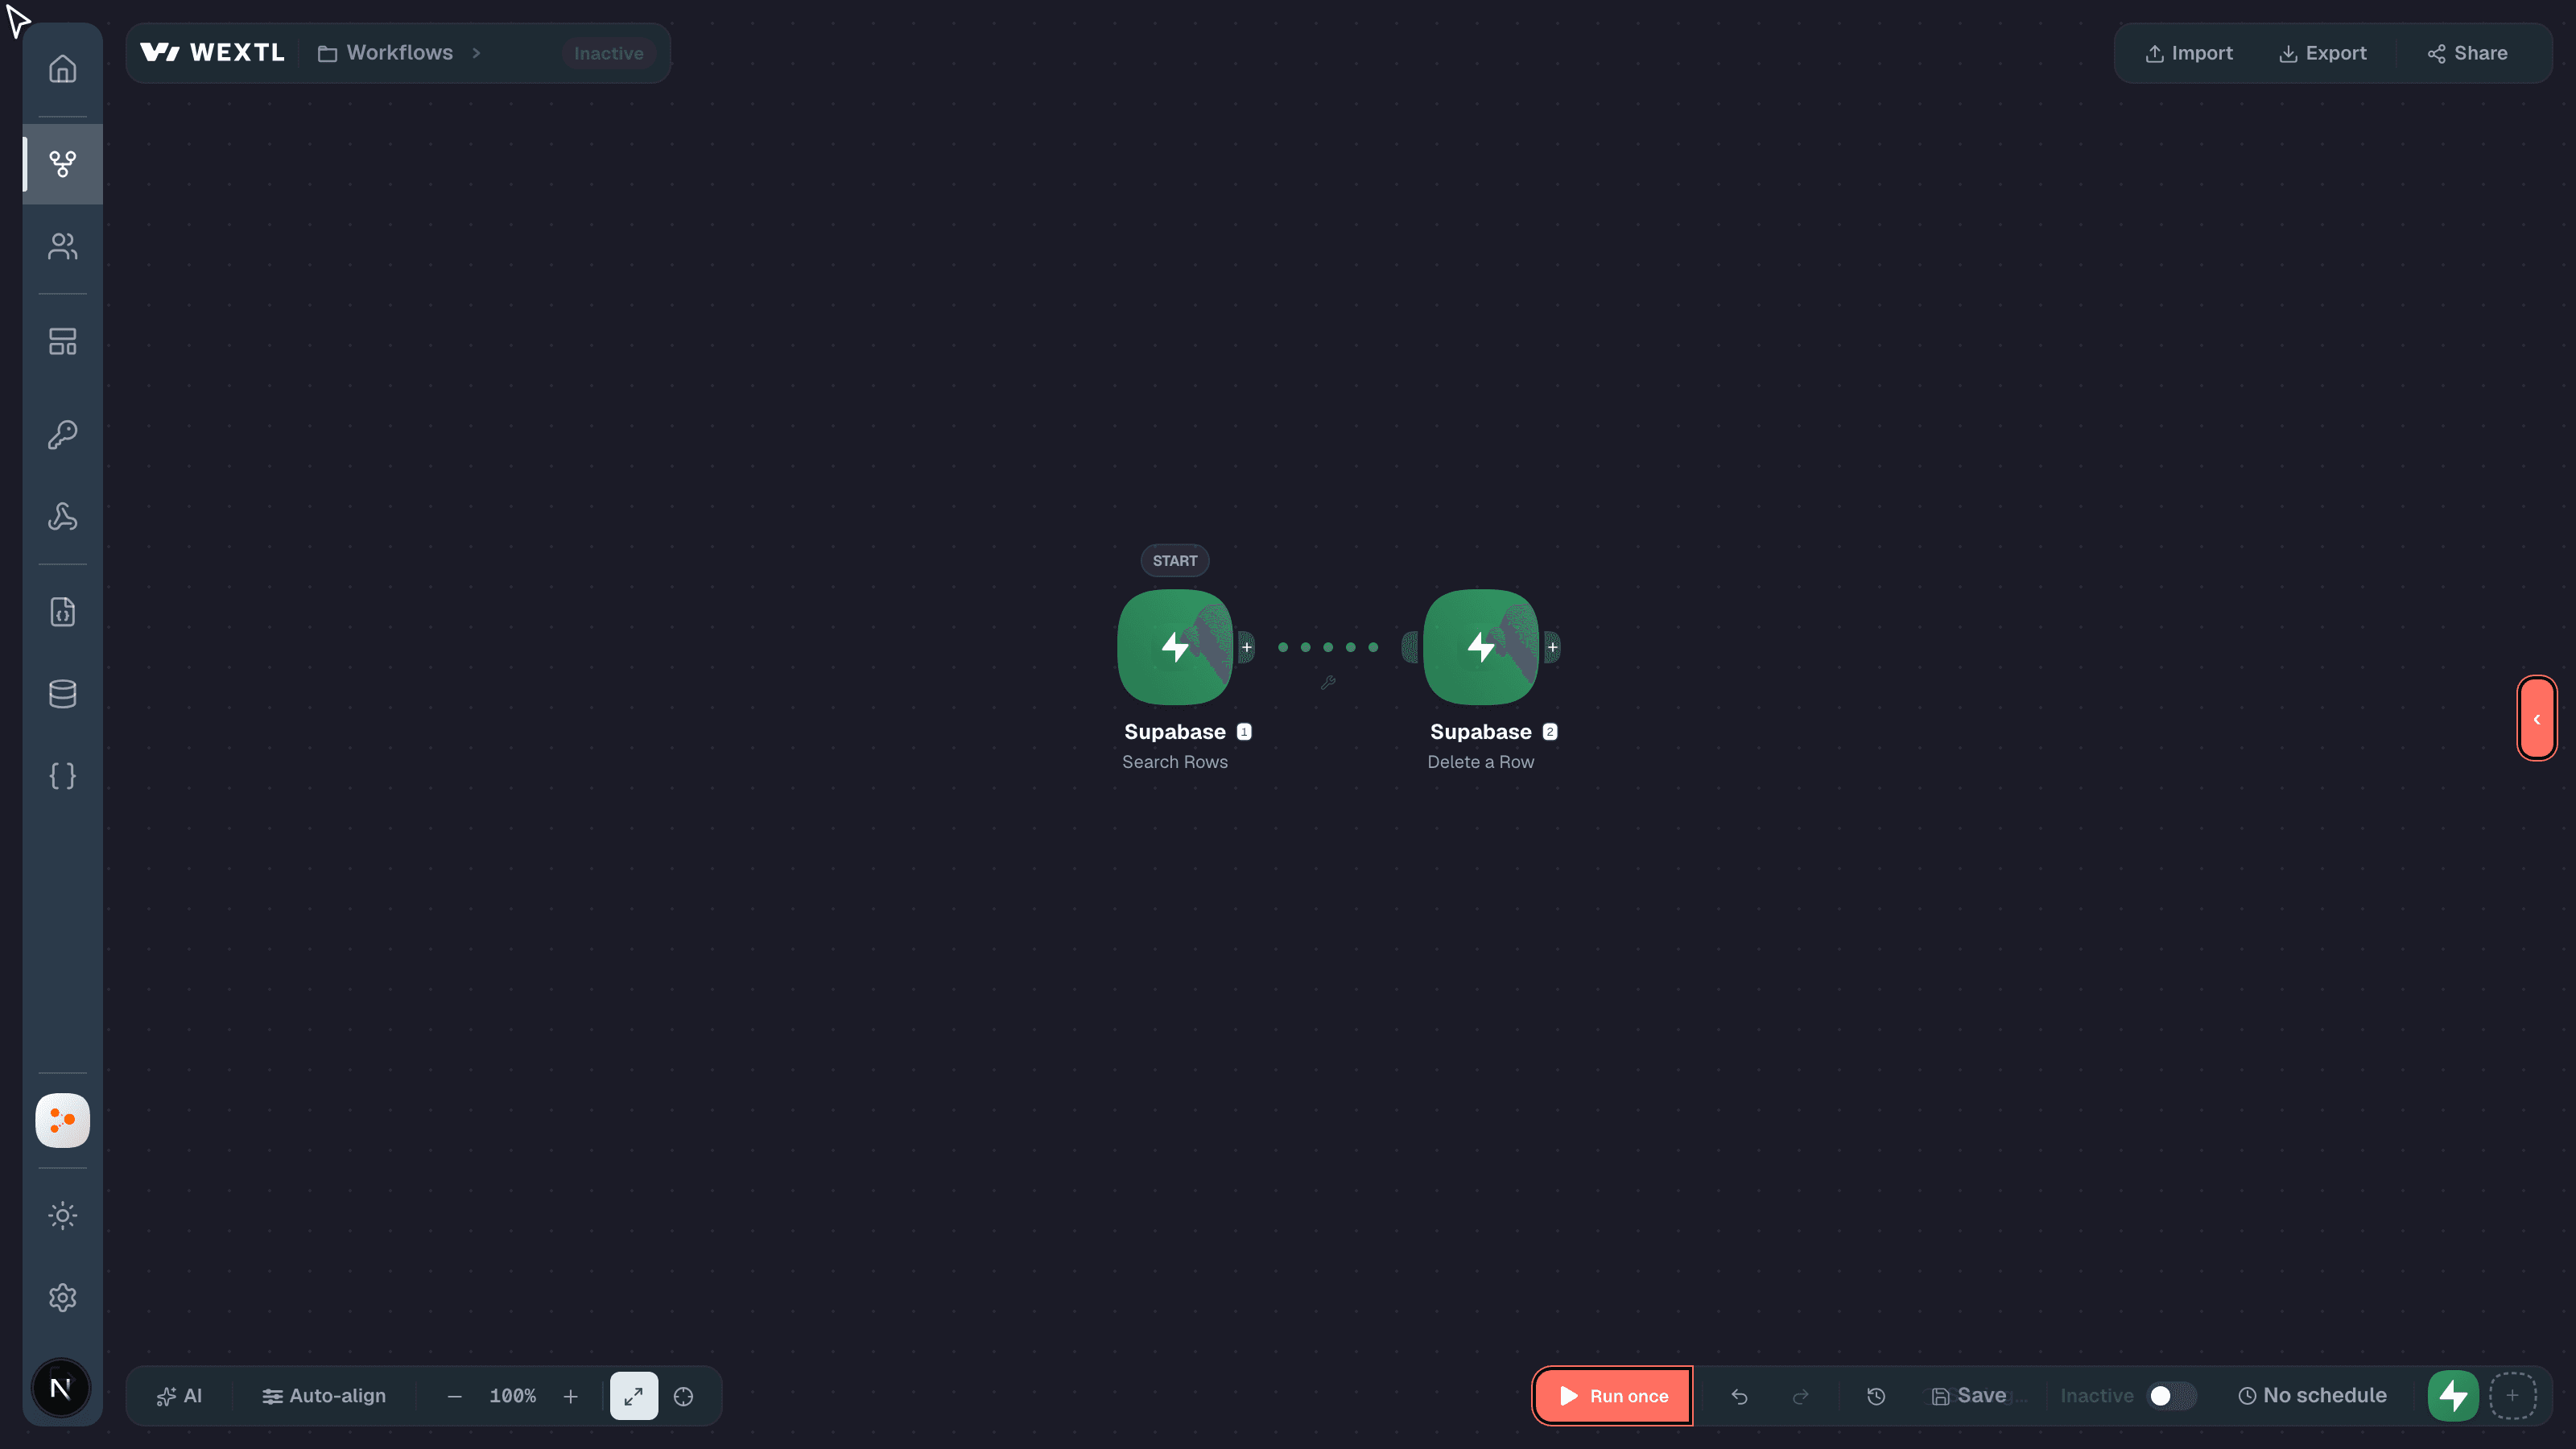
Visual workflow canvas with a loop and connected Supabase app nodes
What Visual workflow builder helps you do
From blank canvas to live run
Three steps — no code required to start.
- 1
Drop typed nodes from the palette
Drag a trigger, an app action, a Condition, a Loop, a JS Code step, or an AI agent onto the canvas — each is its own node with its own ports, not a line in a shared script.
- 2
Branch, merge, and wire the path
Split a Condition node into two paths — say, order value over $500 vs. under — and bring them back together with a Merge node before the next app step runs.
- 3
Test, inspect, then trigger it live
Run it once from the builder, click any node in that run to see exactly what it received and returned, then attach a schedule or webhook so it runs on its own.
Loops, exits, and errors you can point at
A Loop node draws its own body and exit path on the canvas — the branch that repeats and the branch that ends the loop are two different lines you can trace, not two ends of a nested code block.
Point a Loop at 200 rows from a Google Sheet: the loop body runs the per-row app steps, a Condition inside it skips rows already marked done, and the exit path fires once after the last row — all visible before you hit run.
When a run fails on row 137, the node that failed is the one that's highlighted — you don't re-read the whole loop to find which iteration broke.
Every node also carries a small satellite badge in its corner — a spinning asterisk that appears the moment a required field is empty or the account it's connected to needs reauthorization; click it and the node's settings panel opens scrolled straight to the problem.
Drop a Slack action node and leave the channel field empty: the badge shows on the canvas immediately, before you try to activate the workflow — not as a failed run at 2am. Activate runs the same structural check Save does, so a workflow that looks fully wired on screen actually is.
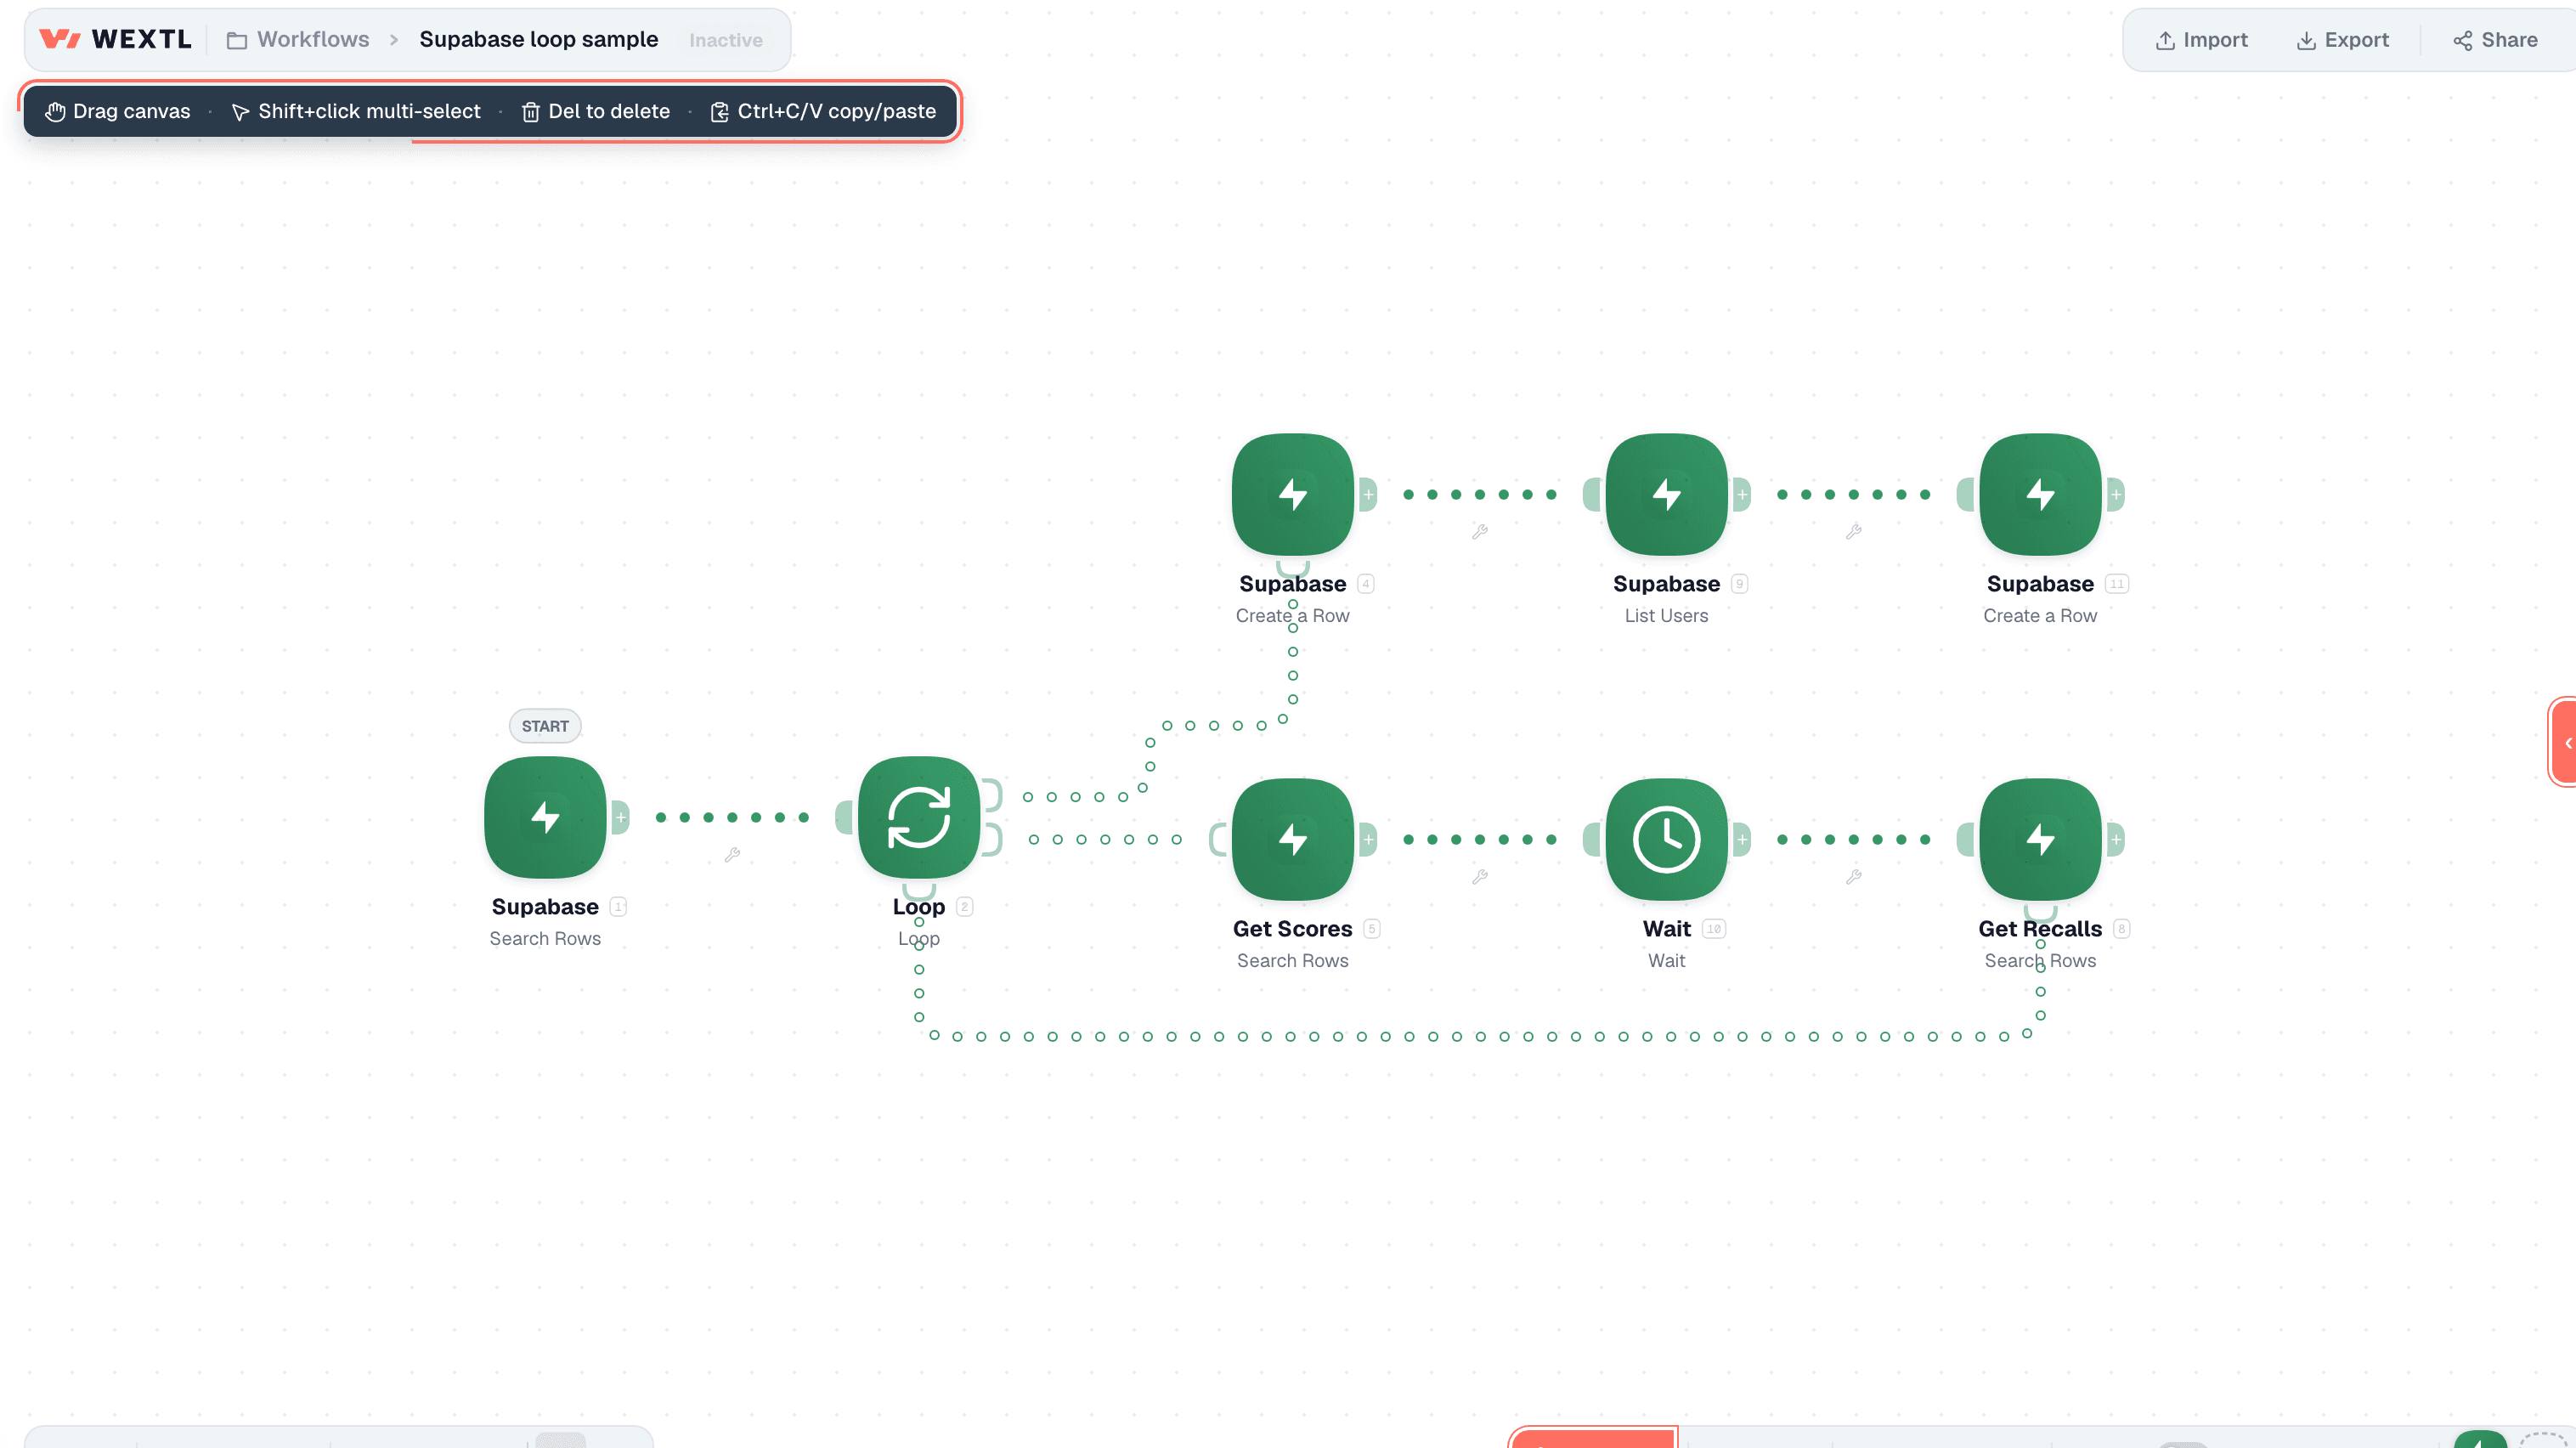
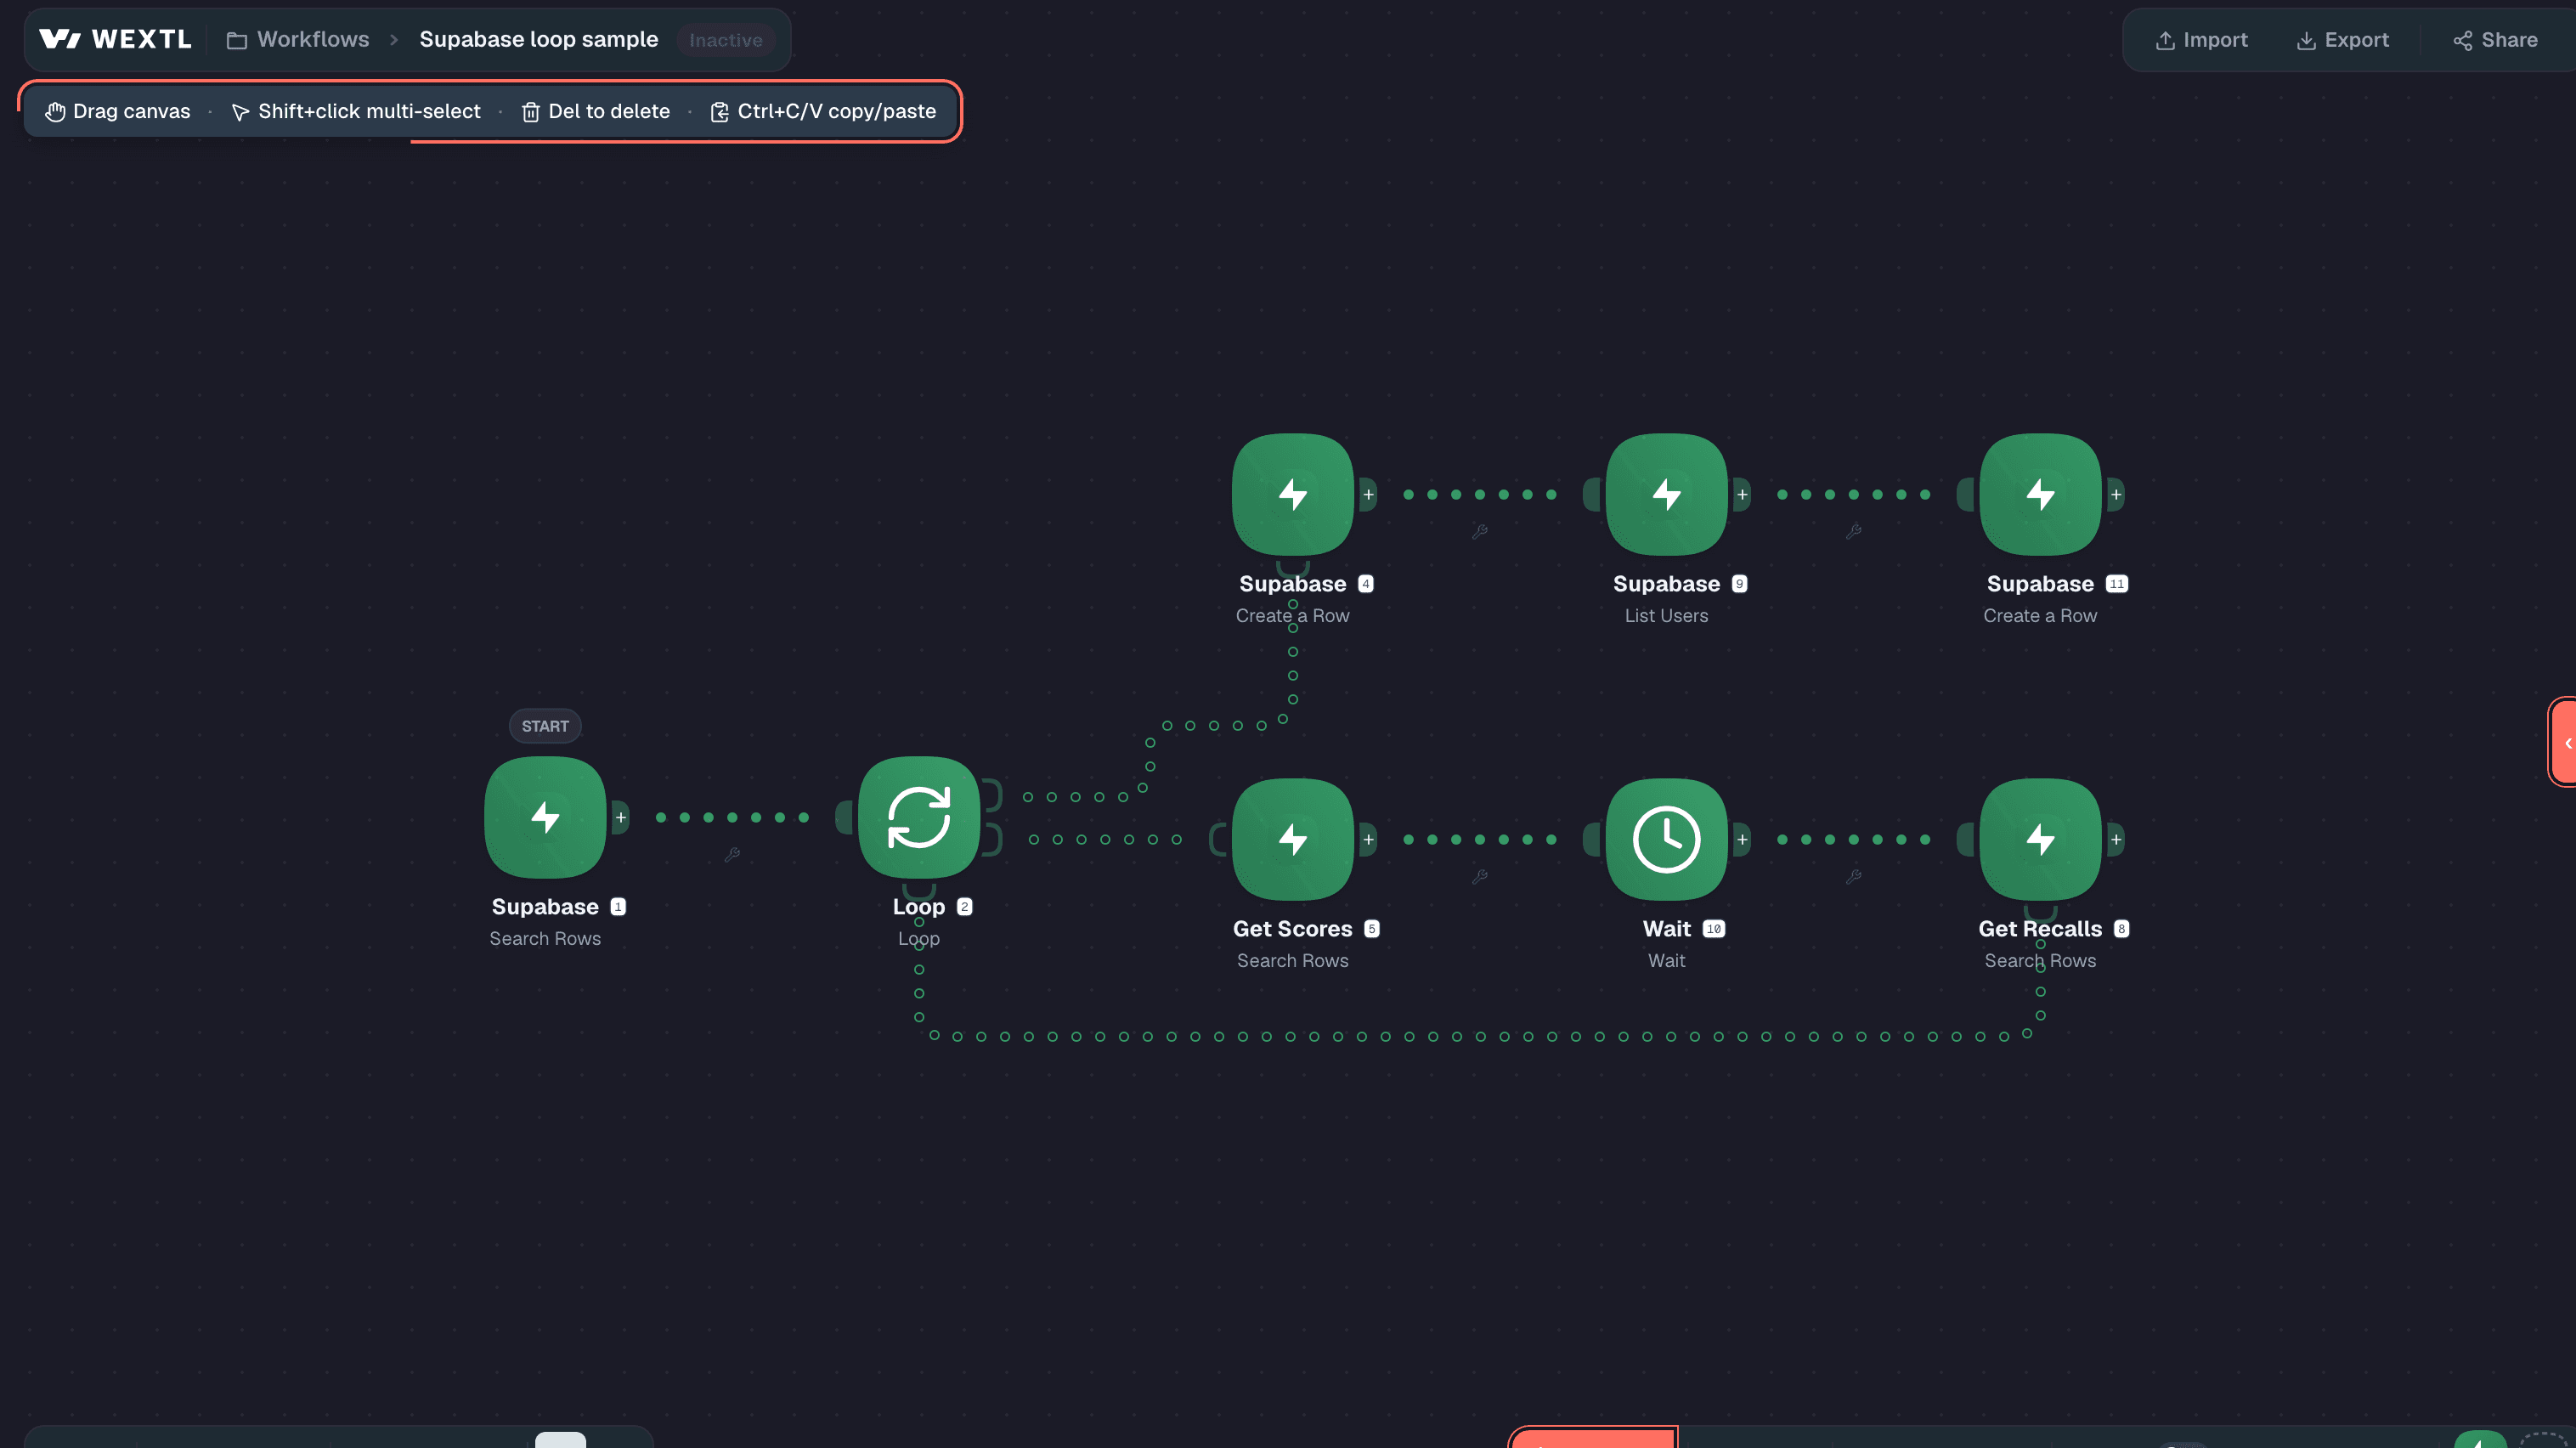
Workflow canvas showing a loop body with visible exit paths
Every node type on one graph, and what happened when it ran
Triggers, app actions, Condition/Merge logic, JS Code, and AI agent steps each get their own icon and color on the canvas — a reviewer scanning a workflow they didn't build can tell which step is a Slack post and which is custom code without opening either one.
A Typeform trigger into a JS Code map step into Pipedrive and a Slack notify reads left to right as four distinct shapes on one graph — the JS Code step is a node like the other three, not a separate service the rest of the flow calls out to.
That's a readability property of the canvas itself, independent of what any one node does — it's why someone on ops can open a workflow an engineer built and follow it without a walkthrough.
Run history draws directly onto that same canvas — open a past run and the node that failed is colored on the graph, not named in a stack trace in a separate tab. Click that node and read the exact payload it received and what it returned, or the error it threw.
Fix the one step that broke and re-run from there — the Pipedrive create and the Slack notify that already succeeded earlier in that run don't replay from scratch.
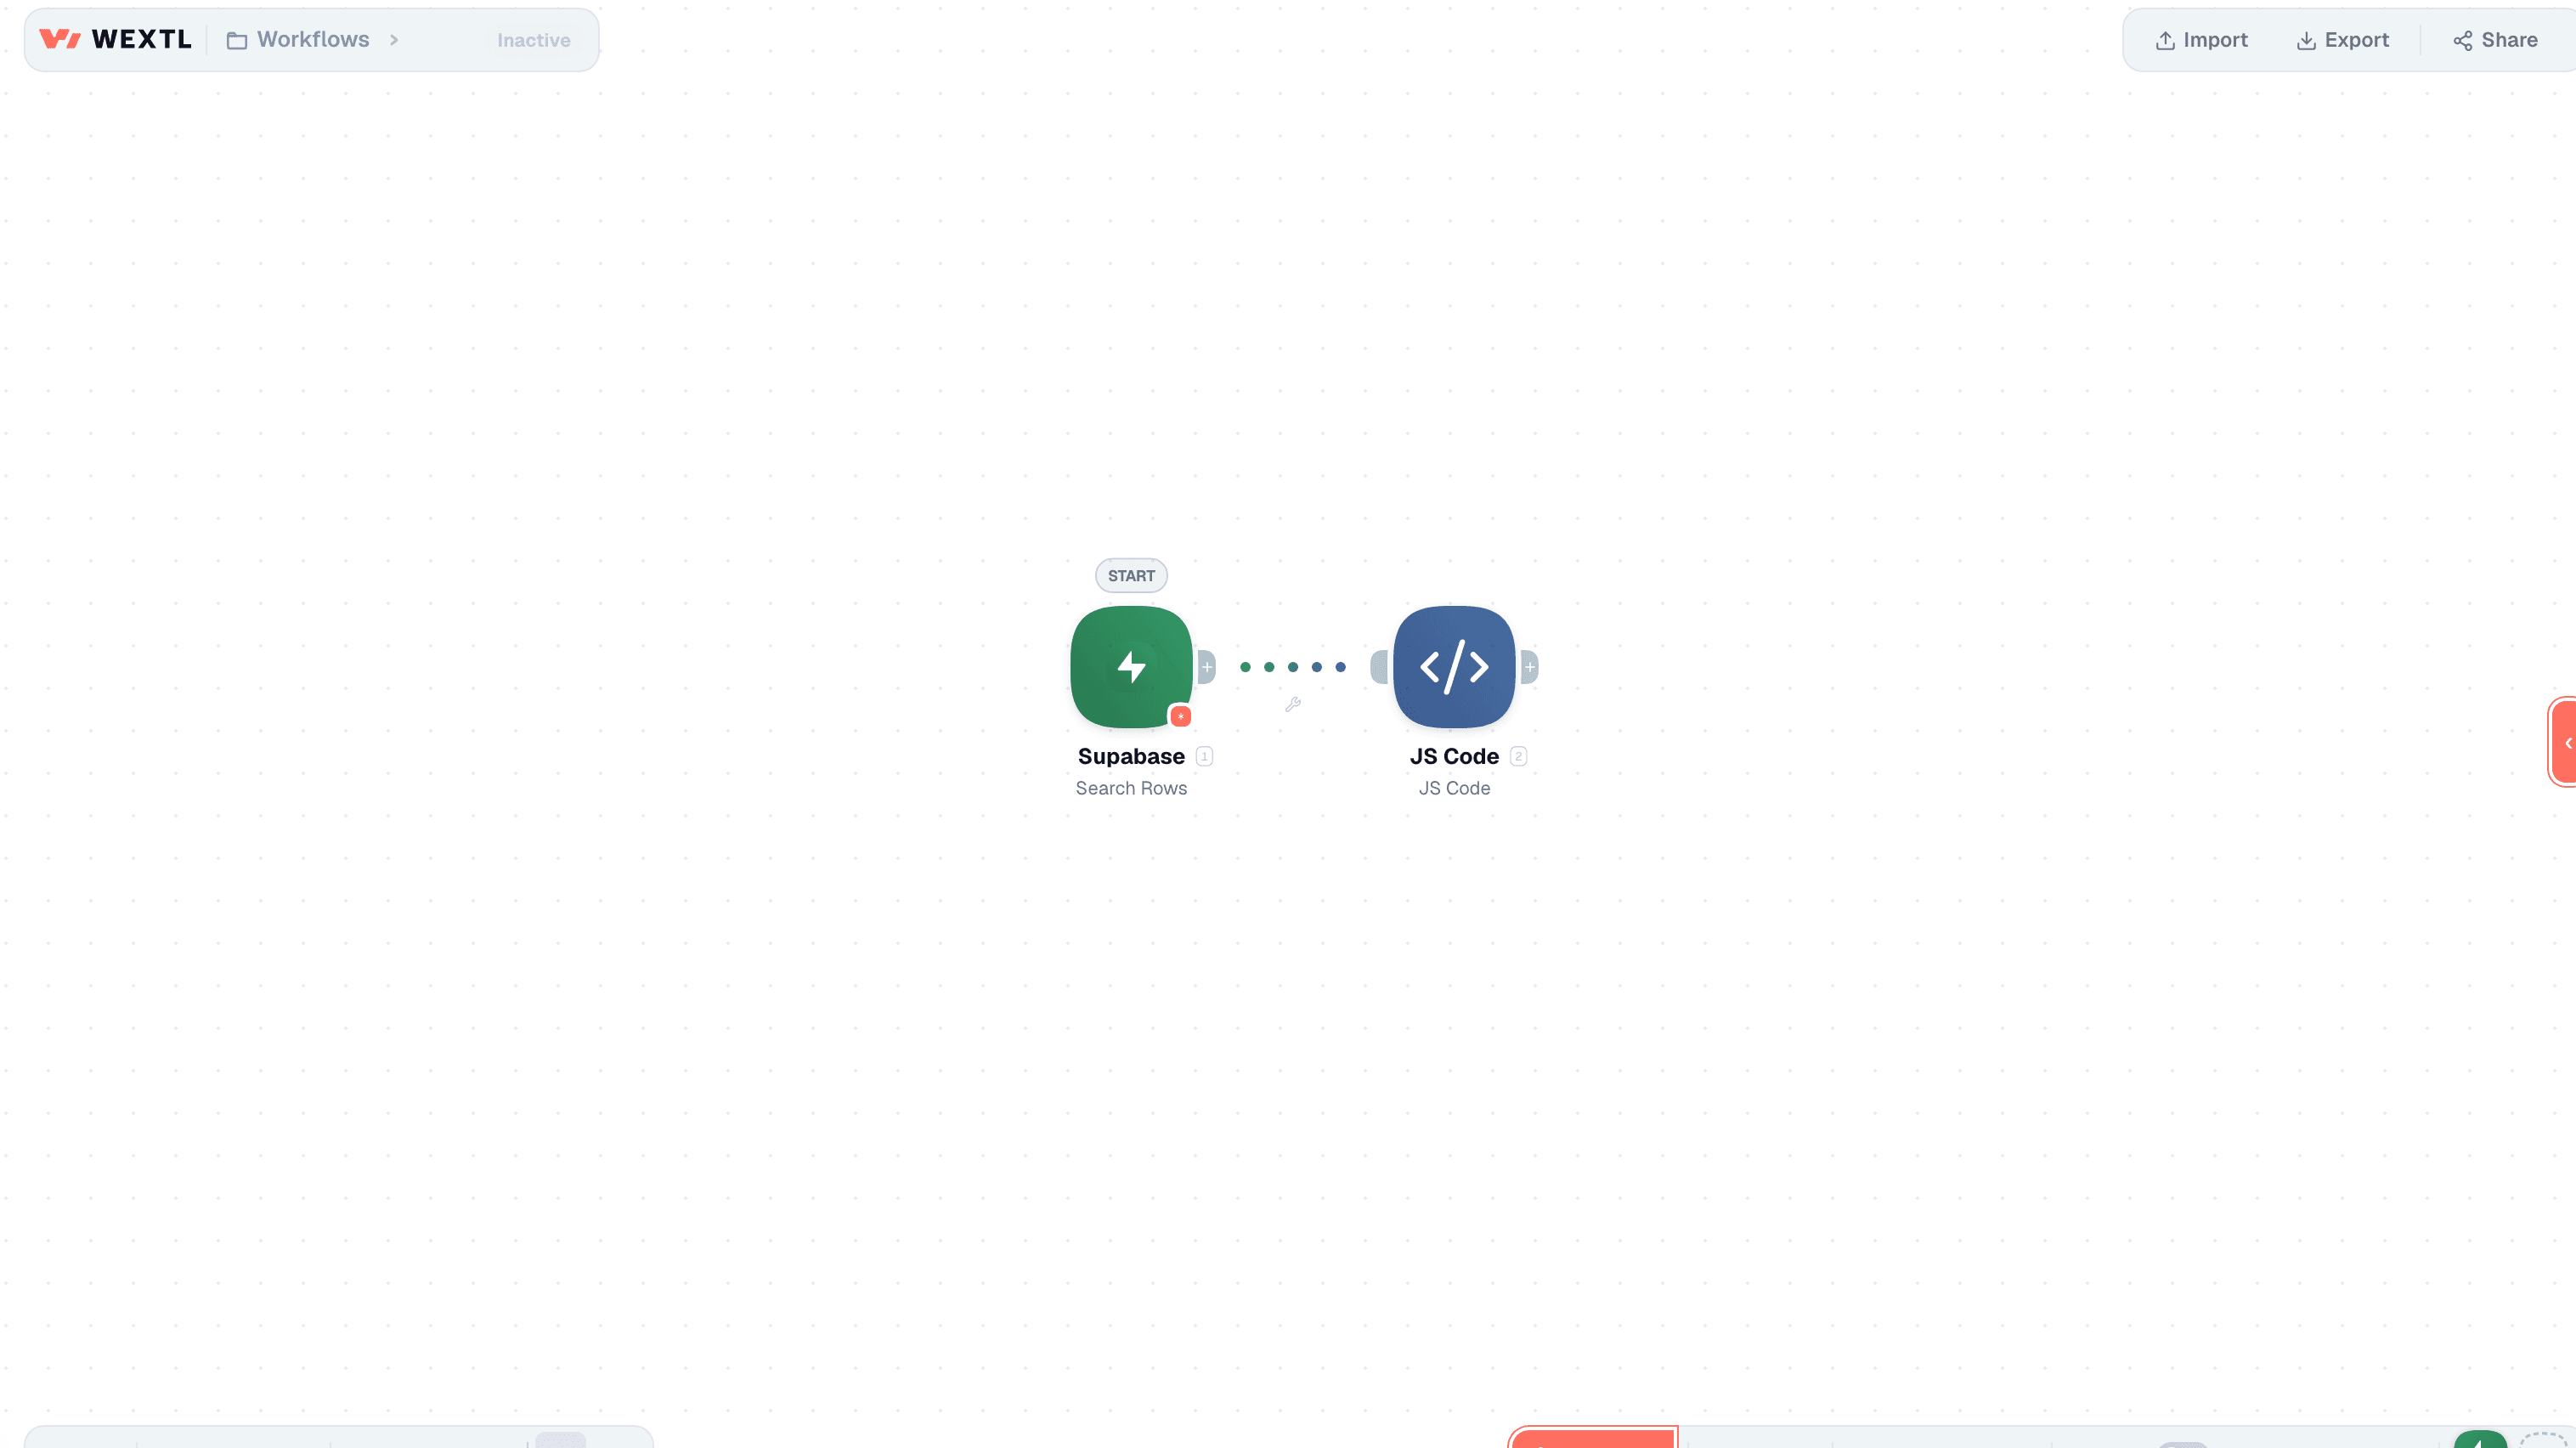
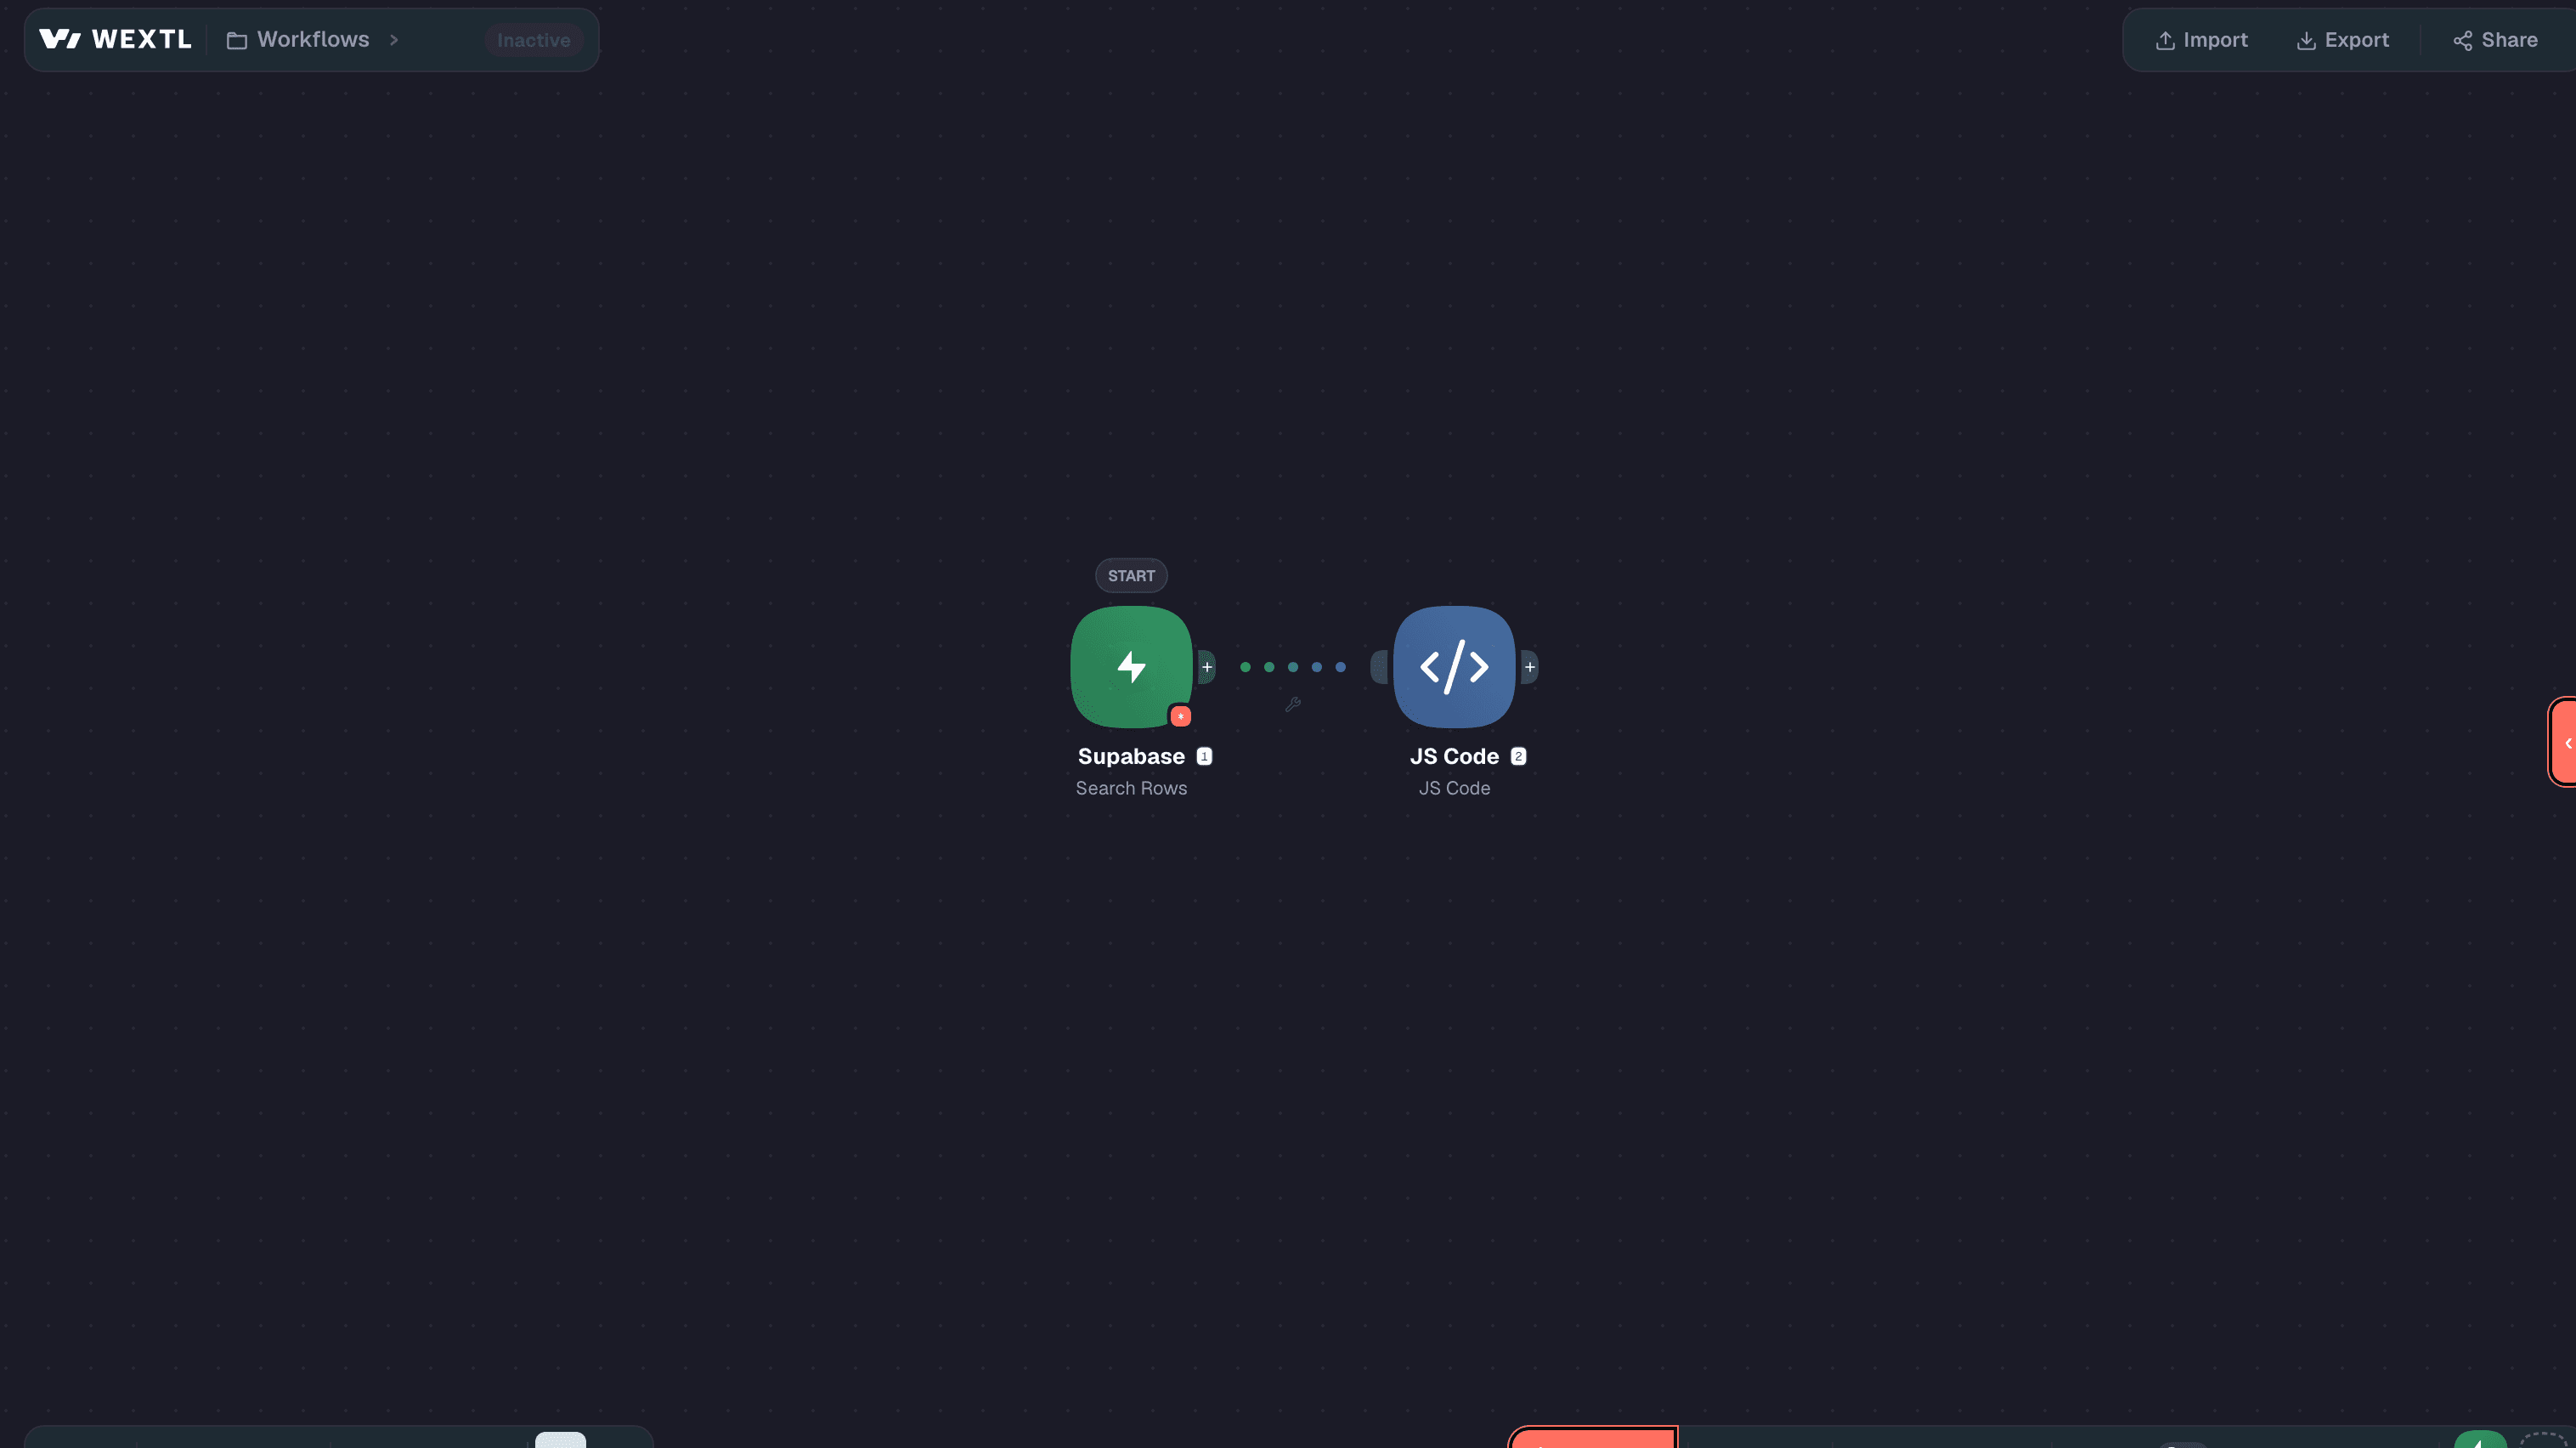
Typeform into JS Code then Pipedrive and Slack on one canvas


