


The numbers show up on schedule
Monday metrics in Slack, Friday summary in the inbox, month-end pack in the drive — built from live data, not from whoever had time to copy-paste. You define the report once and the workflow keeps sending it.
Deploys this workflow into your workspace — you'll connect your own accounts.
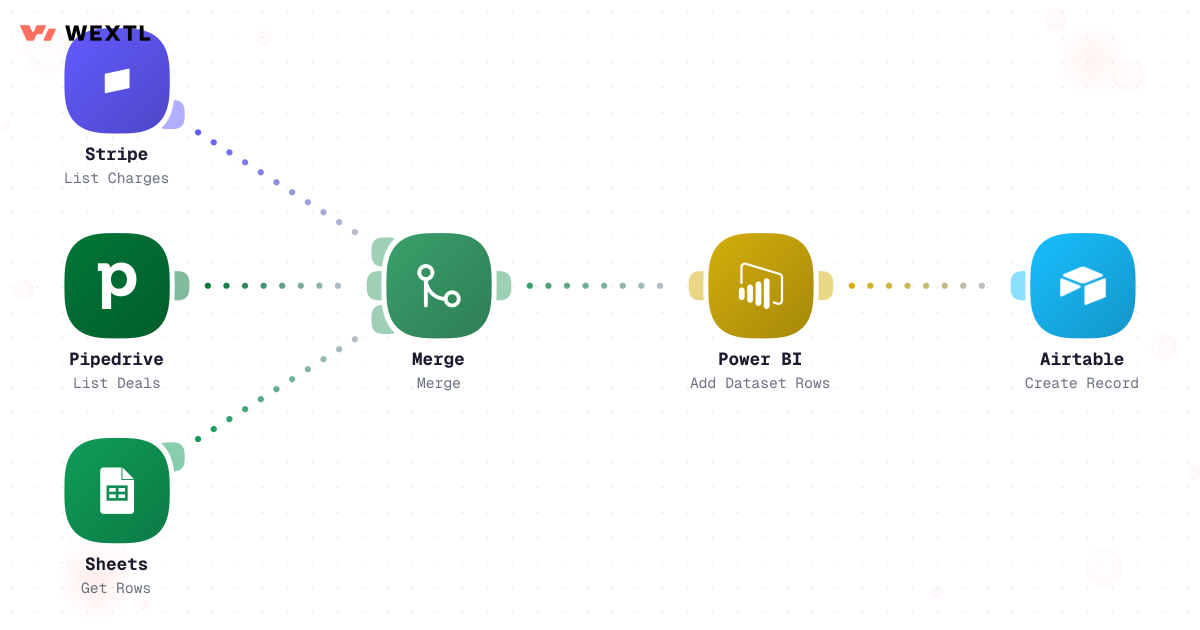
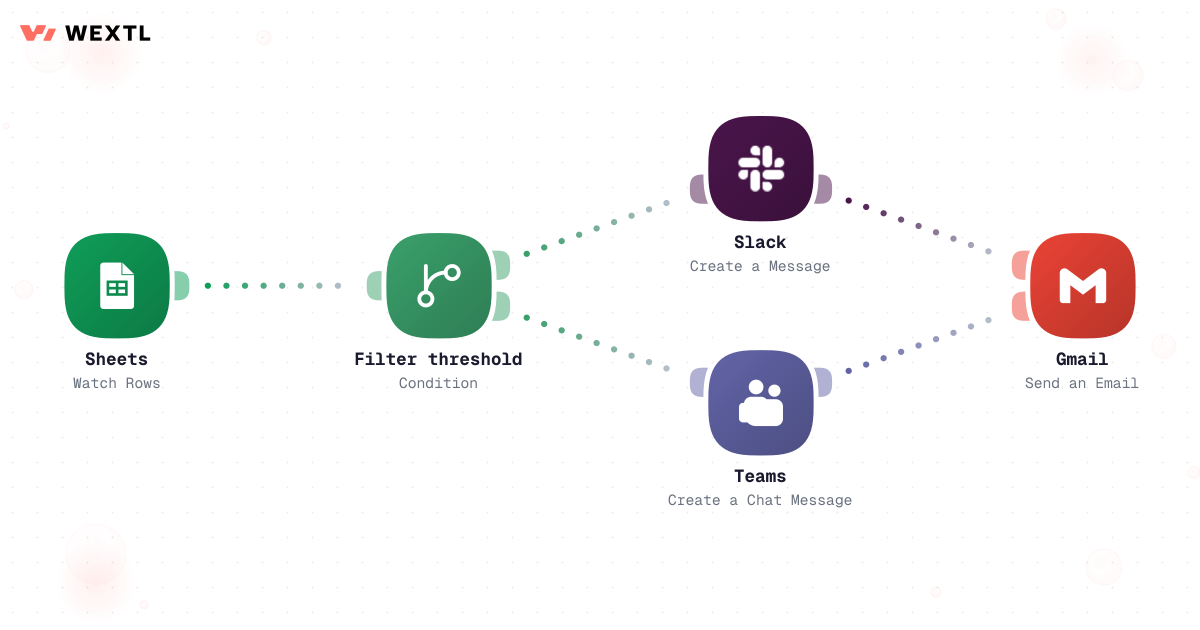
Workflow that loops over data sources and collects rows from each into one dataset
- GDPR
- Data Encryption
- 2FA
- Local Data Region
- 8
- tabs open to reassemble one report, by hand
- 3
- different totals for the same metric, before it's one definition
- 6
- sources joined into a single scheduled run
* Illustrative example, not measured customer data.
Reporting automation, at a glance
From scattered numbers to a standing report
Point the workflow at your sources, shape the numbers, and pick a delivery time. It runs from then on.
Pull from every tool at once
One workflow queries your database, billing system, and ad platforms in a single run — no exports, no tab-switching.
- Trigger — the schedule fires (for example, 7am Monday, or the last business day of the month) or the report owner clicks "run now" to backfill a past period.
- Information collected — the date range for this run, the source queries mapped to this report's saved definition, and which sources are required vs. optional for the send to go out.
- Connected applications — a warehouse or database via an HTTP/native query step, Stripe or QuickBooks for billing figures, Google Analytics for traffic and ad numbers, Salesforce for pipeline, plus Google Sheets or Microsoft Excel for teams still tracking one number by hand.
- Decision logic — each source is checked against a required-freshness rule (for example, "table refreshed within the last 4 hours") before its numbers are trusted for this run.
- AI step — none at this stage; collection is a strict read, not a draft, so nothing here is AI-generated and every number stays traceable to the query that produced it.
- Human approval — none required to collect; a stale or missing source blocks the run automatically instead of asking someone to eyeball whether the data looks right.
- Actions — writes each source's result into one shared dataset for this run, tagged with the source and the exact query that produced it.
- Exception handling — a source still mid-ETL, or one that returns zero rows unexpectedly, holds the whole run and pings the report owner instead of publishing a partial number as if it were complete.
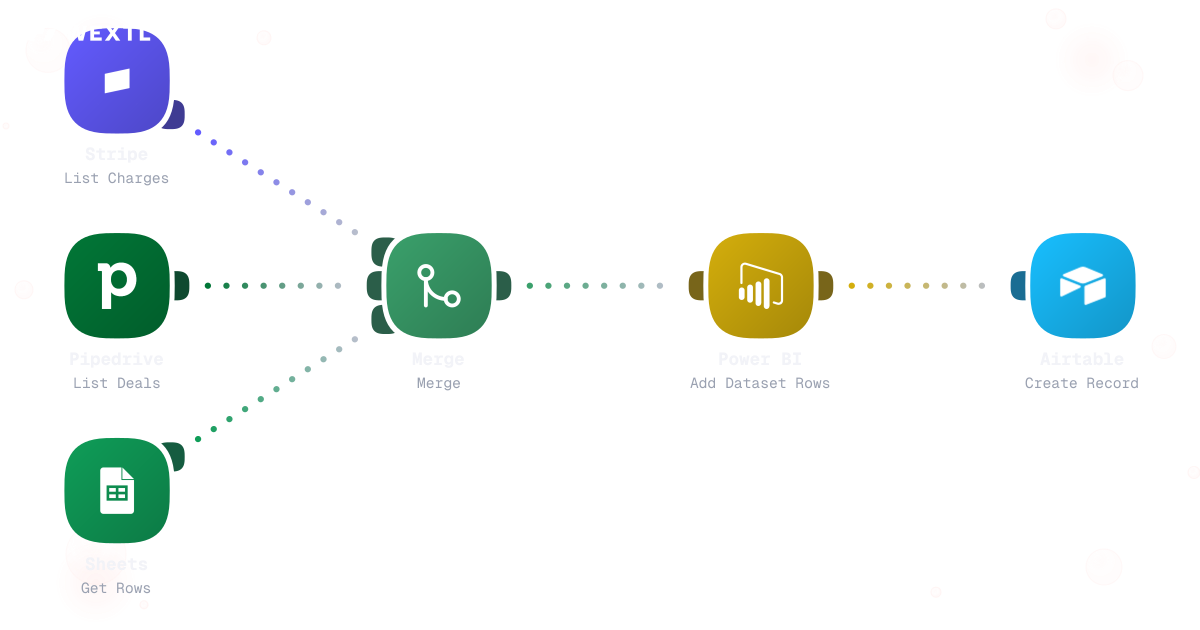
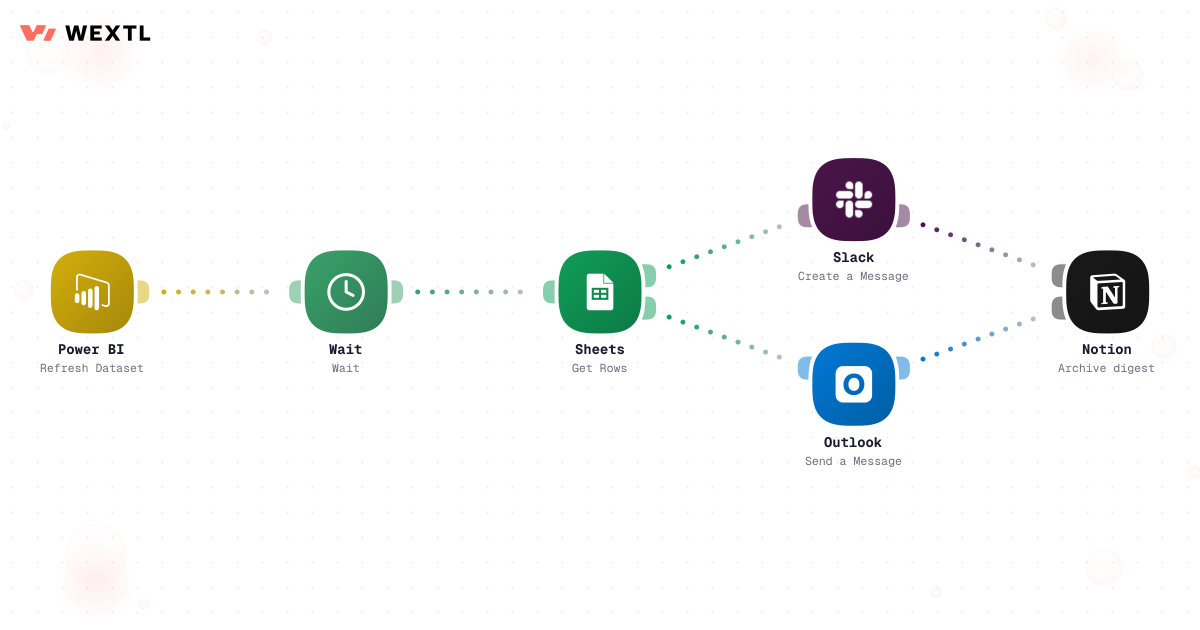
Workflow that loops over data sources and collects rows from each into one dataset
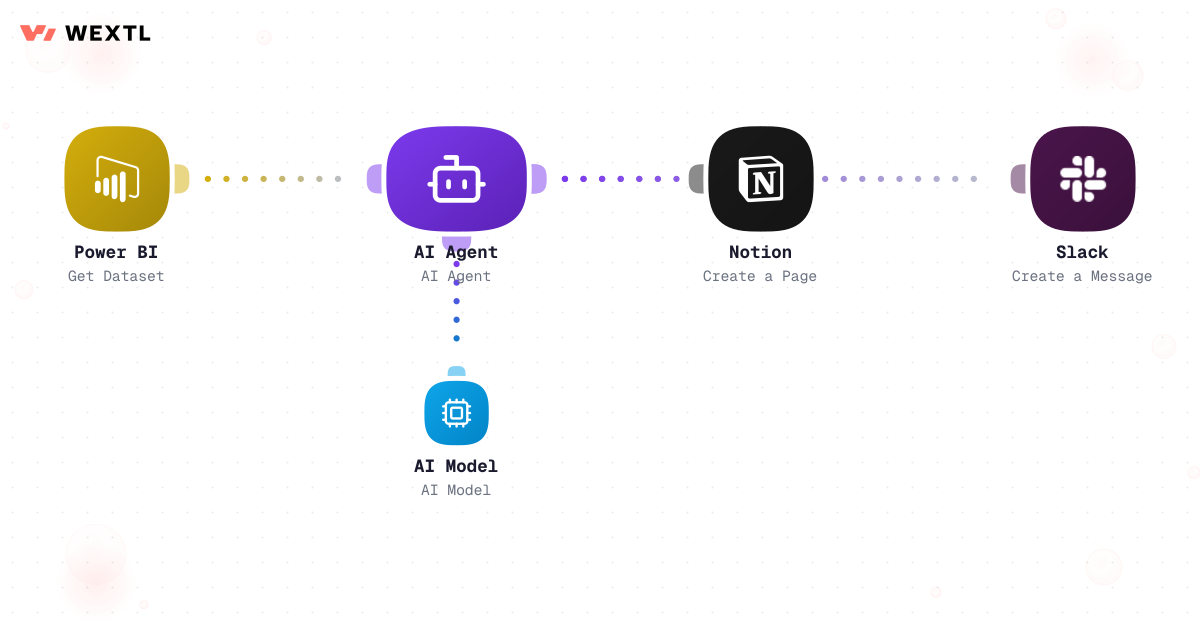
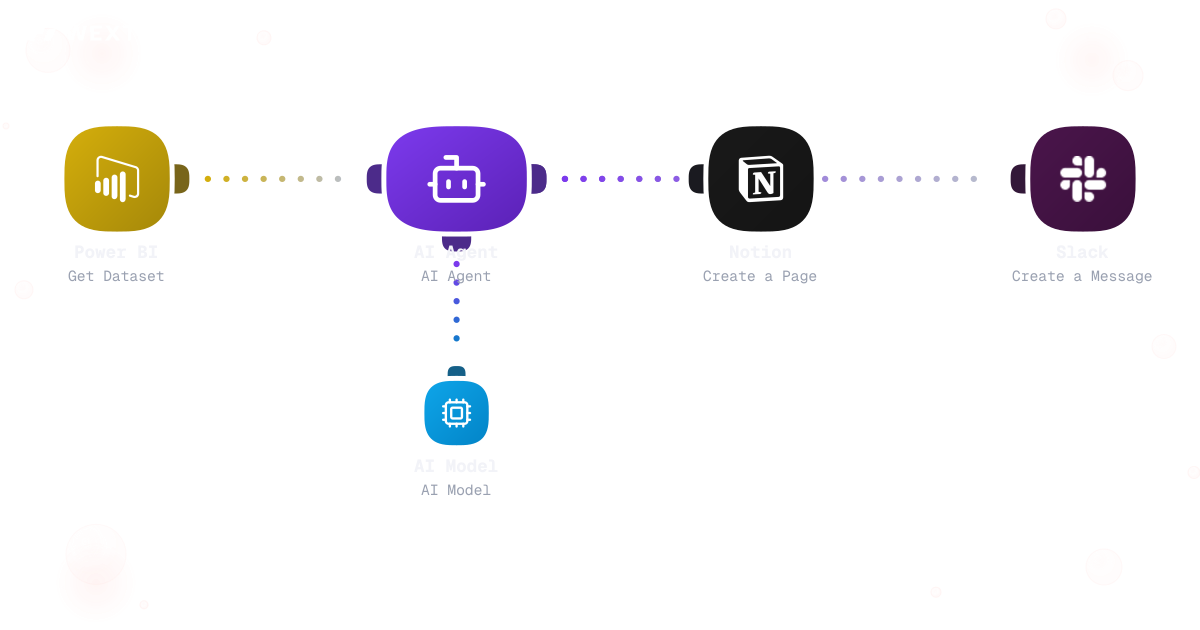
What the person building the Monday report actually fights
None of this is complicated math. A weekly digest is five or six numbers everyone technically has access to somewhere. The work is chasing down where "somewhere" is: eight tabs open across a warehouse, a billing dashboard, an ad platform, and a spreadsheet someone built two summers ago that nobody can fully explain anymore.
The bigger cost shows up as distrust, not lost time. Three people quote three different "total signups" numbers in the same meeting — each pulled from a different query, a different date cutoff, or a stale copy of the sheet. Nobody is wrong on purpose. Nobody is working from the same definition.
- Step 1
Eight tabs, every Friday
Warehouse, billing, ad platform, and a spreadsheet nobody remembers building — reassembled from scratch each time.
- Step 2
Three totals, one meeting
Whoever pulled the number last defines the number, until someone checks the query behind it.
- Step 3
The gap between reports
A metric can fall off a cliff on Tuesday and nobody notices until Friday's readout.
WEXTL doesn't replace whoever owns the report — it removes the part of the job that was never really analysis: finding the number, formatting it the same way twice, and remembering to hit send.
Example: automate the weekly business-review digest
A concrete run, start to finish — the kind of digest a report owner clones from the template library and points at their own sources.
Trigger: the schedule fires Monday at 7am, or someone triggers a manual run to backfill a past week.
Human judgment
A report leaving the team, or a number sitting outside its trailing baseline, holds for review. The routine internal Monday send doesn't wait on anyone.
Example: automate the month-end close reporting pack
The same mechanics, applied to a higher-stakes send: figures that only make sense once the books are actually closed, and a pack that always leaves through a human.
Trigger: the last business day of the month — not a fixed calendar date, so a 31st that falls on a Saturday doesn't fire into a weekend nobody reads until Monday.
Human judgment
Anything board-facing or leaving Finance holds for a person. The workflow assembles the numbers and drafts commentary on the outliers; someone still signs off before it leaves the building.
Judgment showed up exactly where it mattered — the sign-off, the outlier. Everything else just ran on schedule.
Who ends up owning the recurring report
Every team eventually has someone whose name is quietly attached to a number that has to show up on time. This is built for that person, whatever their title happens to be.
RevOps or sales-ops analyst
— Assembling the weekly pipeline and forecast pack from CRM and billing.Marketing analyst
— Pulling channel spend and campaign performance into a Monday send.Finance analyst
— Producing the month-end close pack across billing and the ledger.Data or analytics engineer
— Maintaining the metric definitions every other team's report pulls from.Customer success or ops lead
— Running a weekly or quarterly business review across support and usage data.Engineering or SRE lead
— Reporting uptime and incident metrics to stakeholders on a fixed cadence.
Billing figures land in the archive, not a screenshot
A revenue or MRR line usually starts as a dashboard someone screenshots and pastes into a deck — a number nobody can re-derive a week later.
Pull the figure straight from billing on the same schedule as everything else, and it lands in the archive as a queried number with the query attached, not a picture.


- Step 1
Same schedule, one source
Billing pulls on the same run as every other source, not a separate manual export.
- Step 2
Traceable, not pasted
Each figure keeps the query that produced it, not just a static value.
- Step 3
One archive row
Appended alongside the rest of the digest, not a separate finance-only doc.
Connect the sources a recurring report actually pulls from
A report is only as trustworthy as its weakest source. These are the tools most reporting workflows actually query and deliver through — an HTTP step reaches a warehouse or internal metrics API with nothing native.
Delivery and source apps are wired the same way: query once, format for the audience, send where the team already reads.


