


Monitor every workflow run
Every execution leaves a trail — status, timestamps, credits, and payloads. WEXTL run history lives in the builder’s Runs sidebar so debugging never leaves the canvas.
- GDPR
- Data Encryption
- 2FA
- Local Data Region


Runs sidebar listing recent workflow executions with status badges
What Run history helps you do
From trigger to evidence
- 1
Trigger fires, run opens
A webhook hit, a schedule tick, or a manual Run once from the builder each create a run entry in the sidebar the instant they start — the trigger type and start time are visible before any step has executed.
- 2
Every node checkpoints its data
Each step commits its inputs and outputs as it completes — an HTTP response, a JS Code return value, an AI agent's tool call and arguments — so the run is a step-by-step record, not just a pass/fail summary.
- 3
Open the failed step, fix it, rerun
Click the red node in the Runs sidebar to read its input payload and error text, adjust the workflow on the same canvas, then rerun — the failed run stays in history so you can compare it against the new one.
Triage needs-attention runs before they queue up
Every run lands in the Runs tab with a status chip — succeeded, failed, or needs-attention — plus relative time and the credits it consumed, so a stalled nightly sync doesn't sit unnoticed for a week.
Example: a workflow syncs Stripe payouts to a spreadsheet every night. Filter to needs-attention and you land directly on the one run where the Sheets append step waited on a rate limit, instead of paging through thirty successful ticks to find it.
The credit chip on each run also flags retries burning plan usage before they show up as a surprise on the invoice.
A scheduled tick and a webhook-triggered run leave the same kind of record — trigger type, start time, and every step's result — so "did the Monday report actually send" has a run to point to instead of a guess.
Example: a weekly digest workflow is scheduled for 8am Monday. If a stakeholder asks whether it ran, you open that workflow's run history and see the exact tick — not the org Audit log, which records who edited the workflow's schedule, not what the workflow did when it ran.
That's the actual difference between run history and the Audit log: execution evidence versus configuration history — two different records for two different questions.
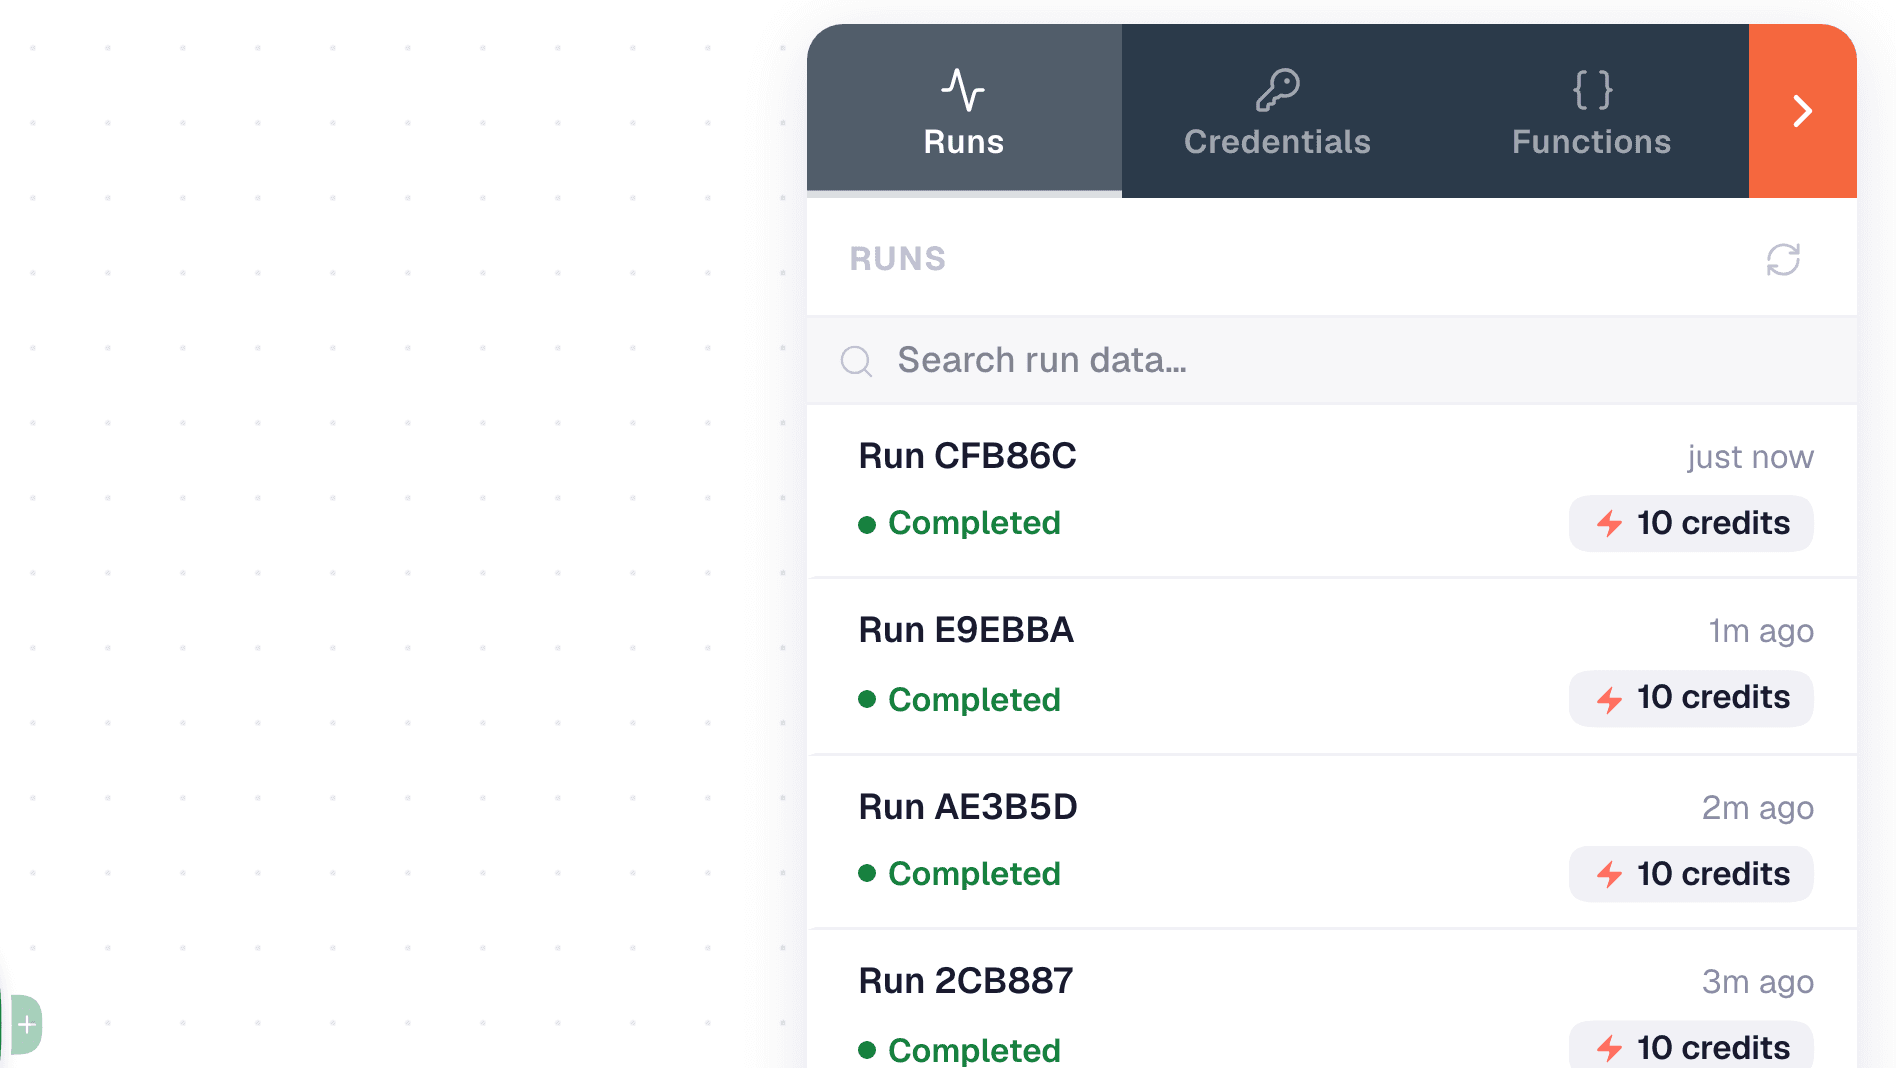
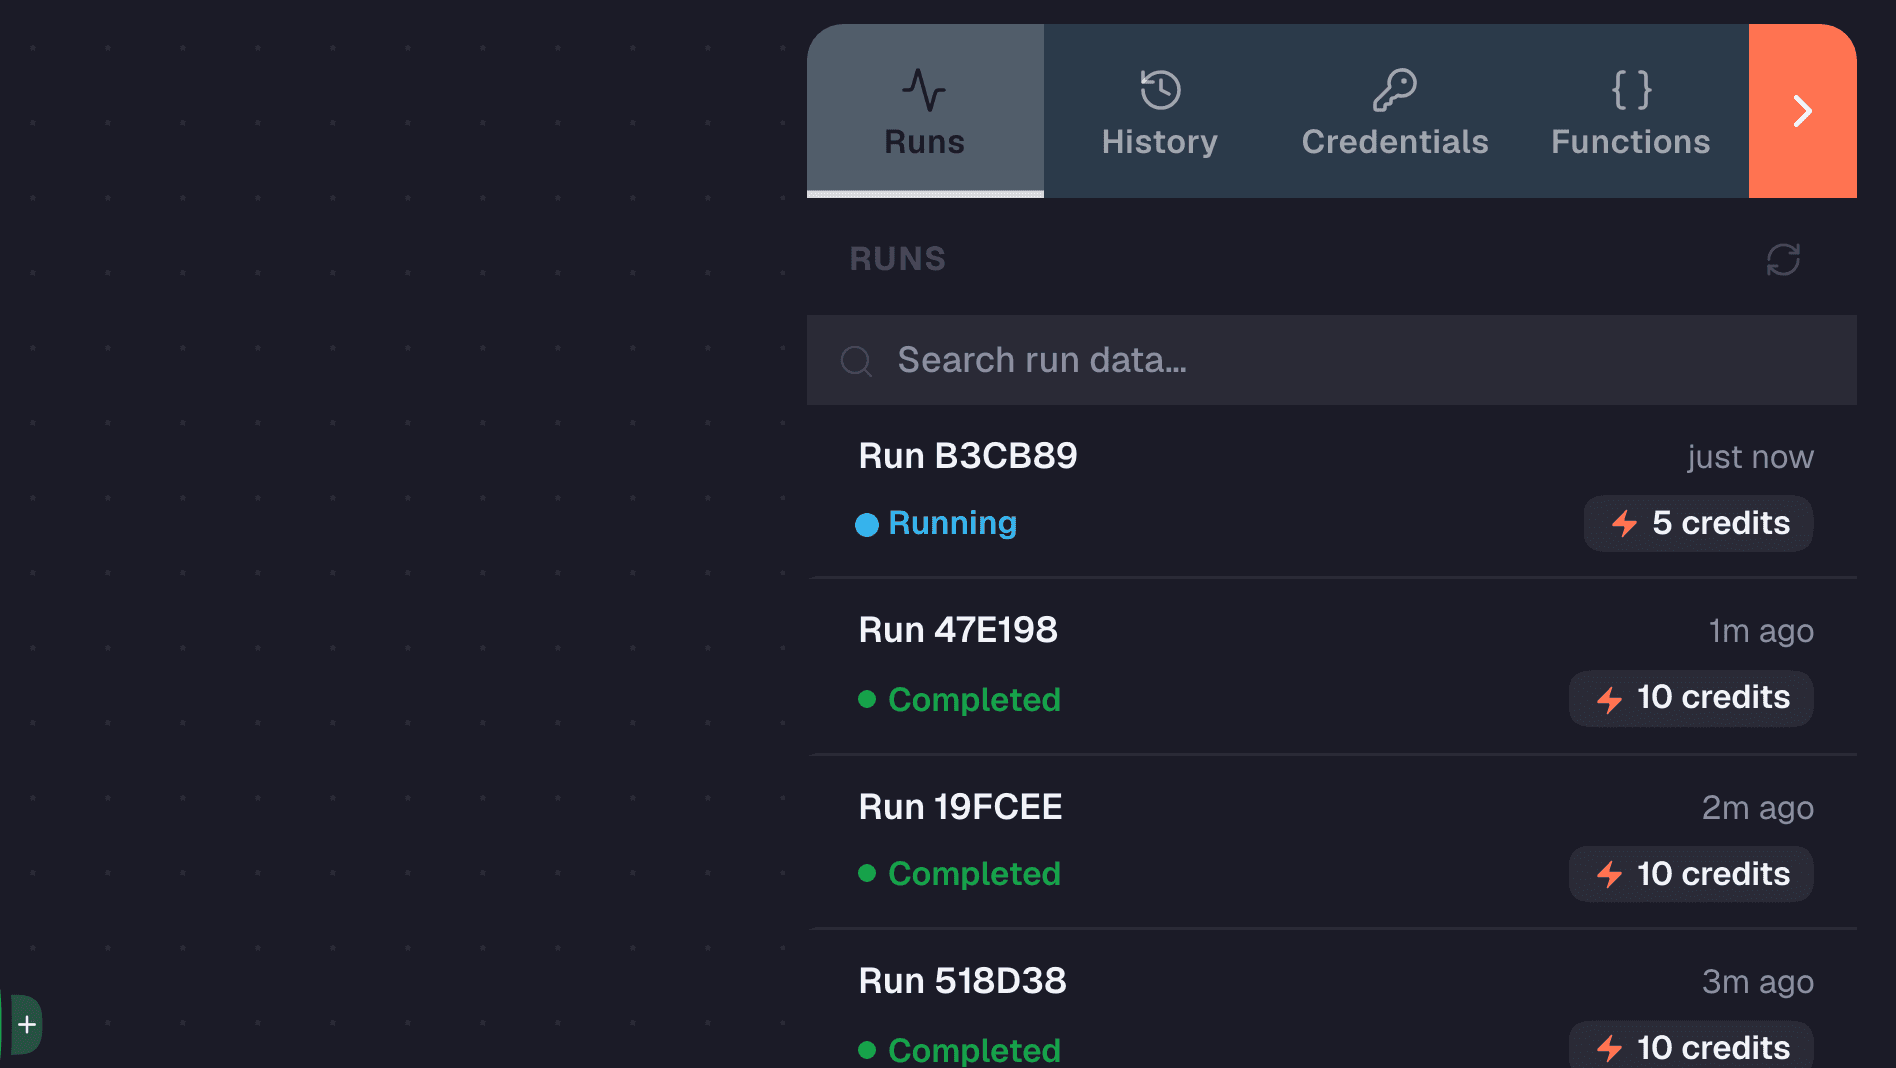
Runs list filters including needs-attention and status chips
Search payload text, not just run IDs
Full-text search (on plans that include it) matches against what actually moved through the workflow — an order number, an email address, a Slack message body — not only the run's UUID.
Example: a Shopify-to-fulfillment workflow processed 4,000 orders overnight. Search "SKU-88421" and you land on the one run whose payload contains it, with the matching node already open and the term highlighted in the results panel.
You're finding the broken record by what it says, not by scrolling runs in date order hoping to spot it.
A JS Code step's return value, a webhook's raw payload, an AI agent's tool call and the arguments it sent — each shows up on that exact node inside the run, not in a separate service's log stream.
Example: an agent workflow scores inbound leads and writes the score to your CRM. When a lead comes through with no score, open the run, click the agent node, and read the tool call the model actually made — not just "step failed."
You're debugging the workflow you built, on the canvas you built it on — no correlating a request ID across two dashboards.
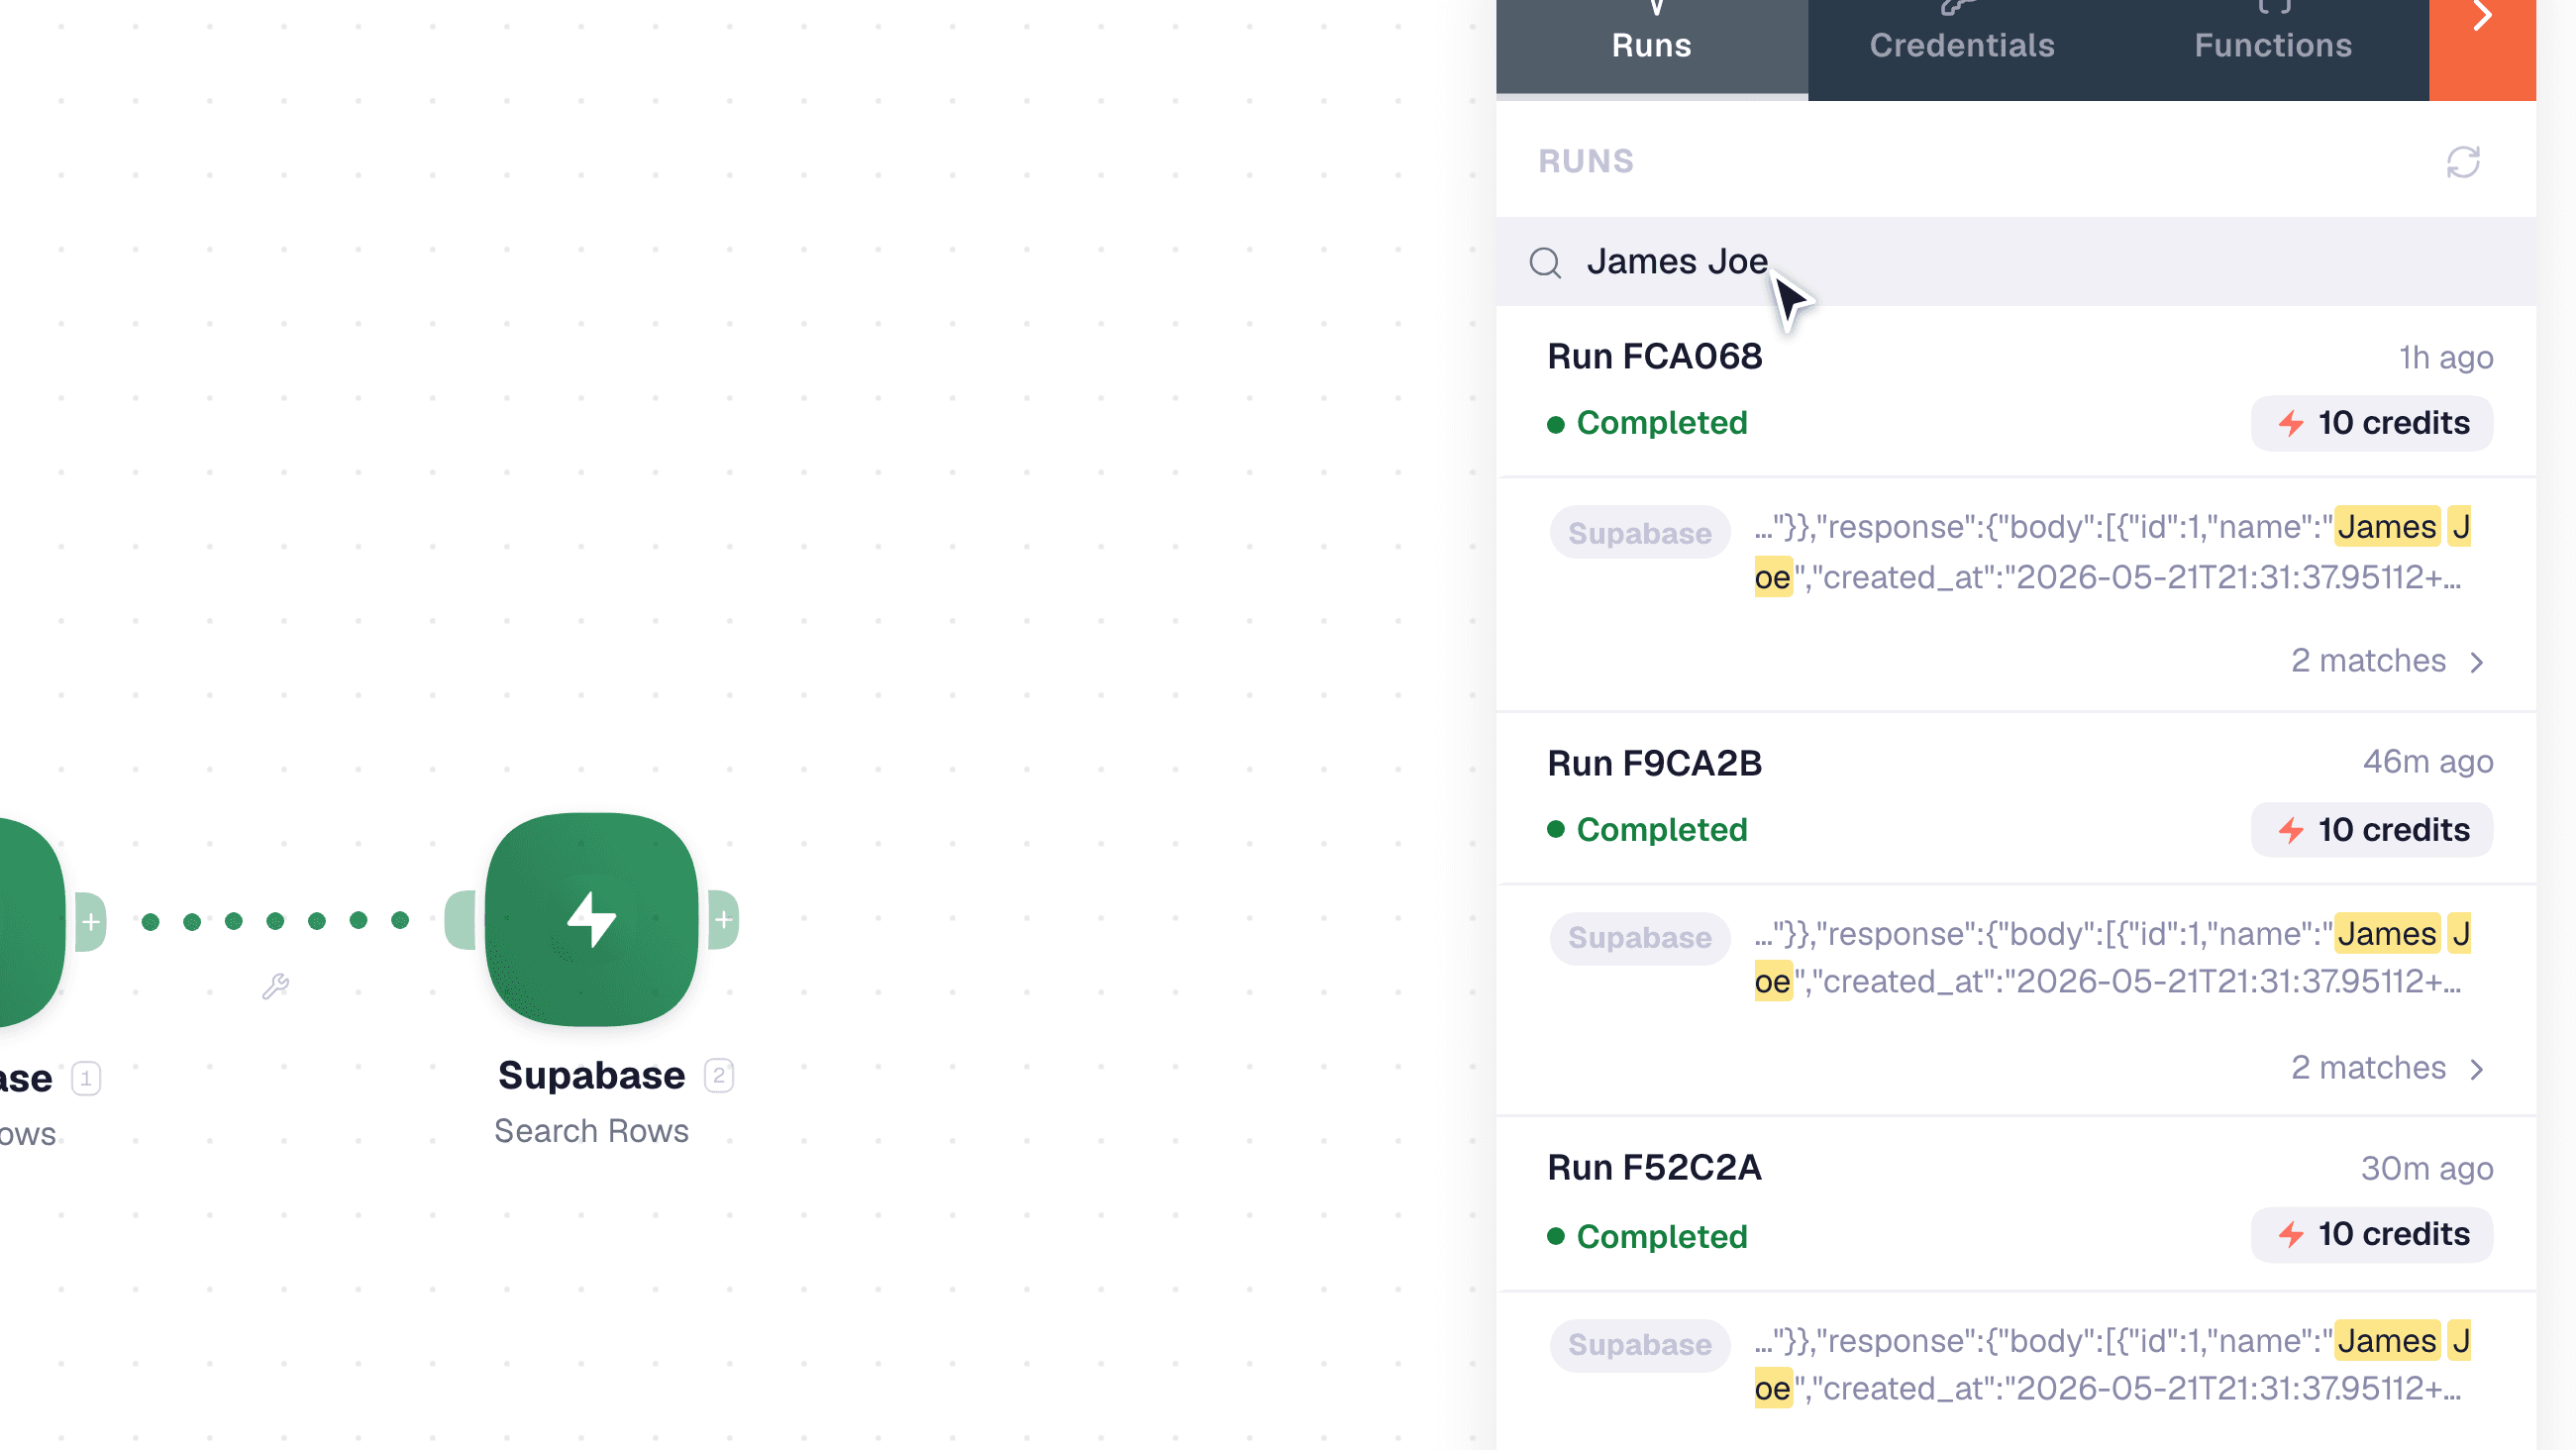
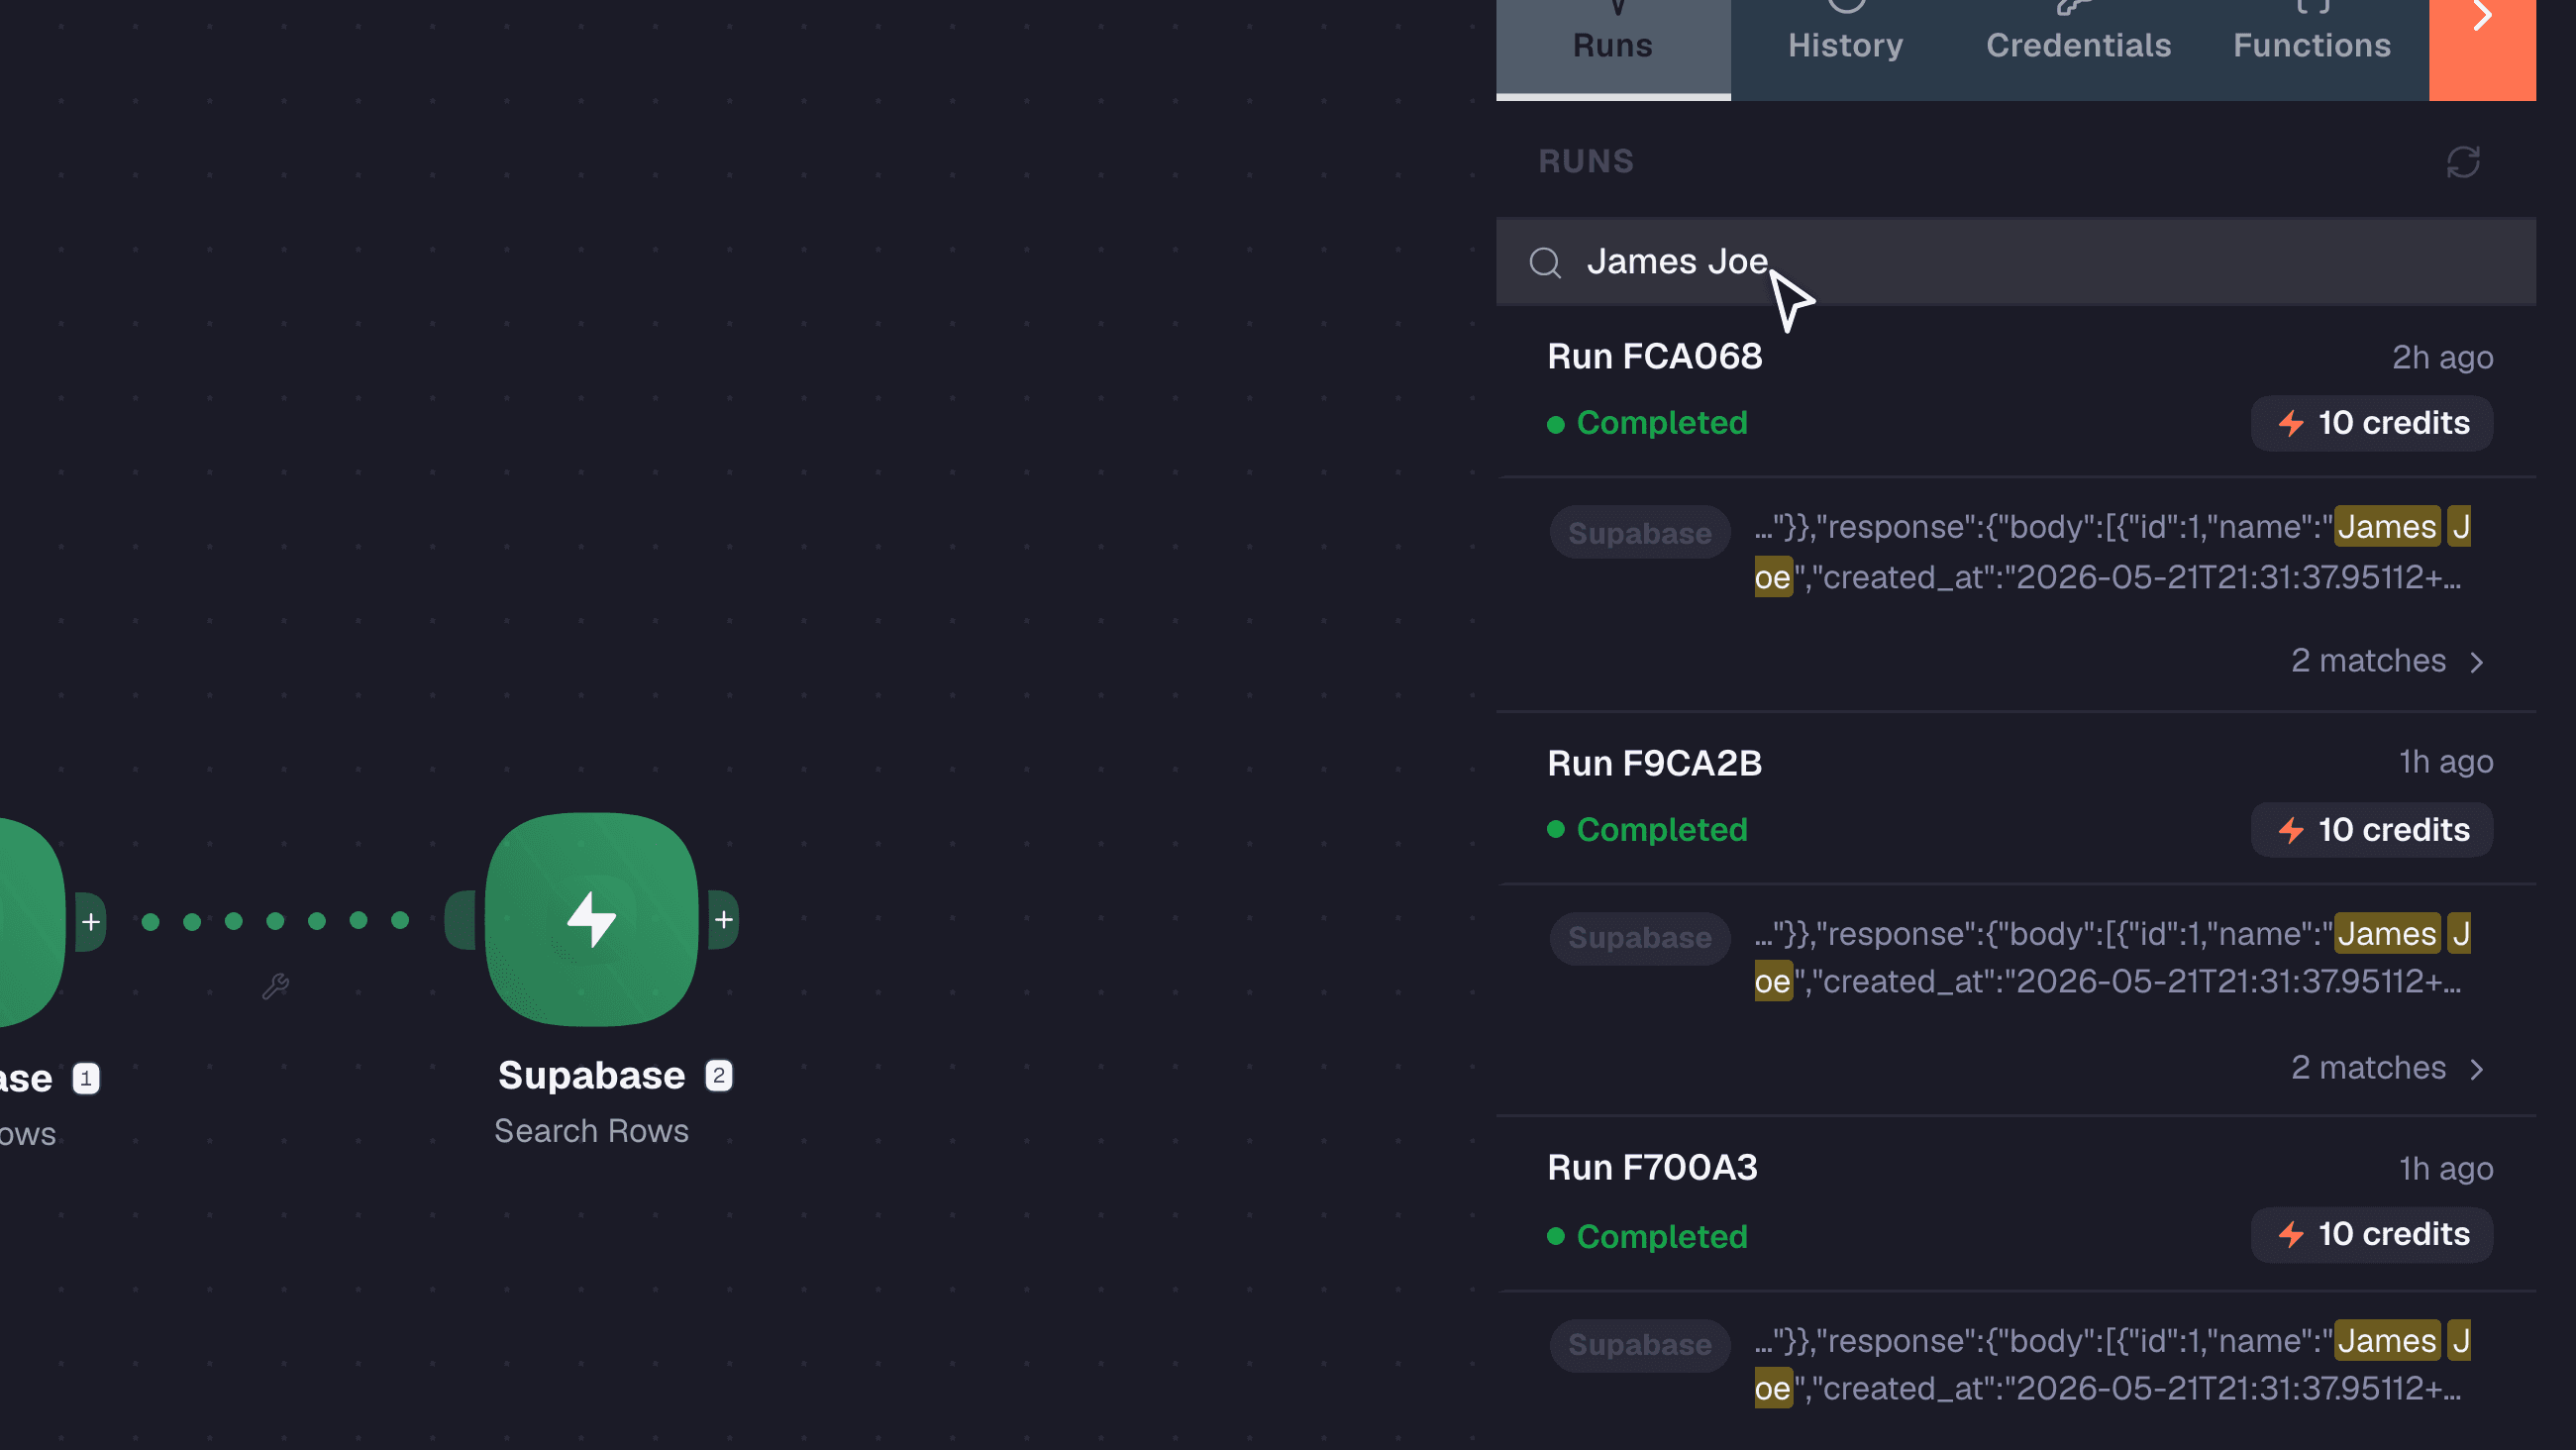
Runs sidebar full-text search for James Joe with matching run hits highlighted